"Timer Digest" has Tim Ord ranked #5 for one year ending 6/3/05 and #1 in Gold for one year ending 1/13/06.
For 30 to 90 days horizon: Long Nasdaq on 6/28 at 2111.84. Long SPX on 6/29 at 1272.87.
Monitoring purposes XAU: Long XAU, 129.56 on 12/29/05.
Longer Term Trend monitoring purposes: Short SPX On 3/21/06 at 1297.23.
We have "800" phone update that cost $2.00 a min. and billed to a credit card. Call (1-970-224-3981) for sign up. We update Eastern time at 9:45; 3:15 and 4:00. Question? Call me (402) 486-0362.
What to expect now:
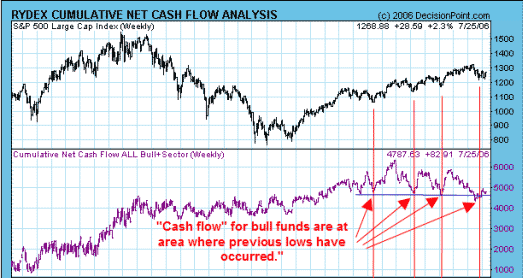
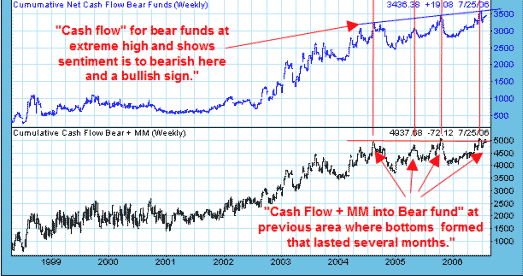
The SPX chart with its “Rydex Cumulative Net Cash Flow analysis” is displayed below, courtesy of www.decisionpoint.com. “Cumulative Net Cash flow” Charts shows the amount of funds flowing into and out of the Rydex bull and bearish funds for the SPX. When a high level of funds are flowing into the long side for the SPX, it implies that the public is way to bullish on the current run and a bearish sign. When cash is flowing out and at an extreme low level on the Rydex Bullish fund for the SPX then that shows the public is not bullish on that fund and do not expect it to move up for near term and is a bullish sign. The same condition work for the bear funds as well. The bottom chart on the “Rydex Cumulative Net Cash Flow Analysis” Shows a very high cash flow going into the bear fund, which in turn is a bullish sign for the market. The chart under the SPX chart shows a very low rate of cash flow going into the Bull fund and in turn a bullish sign. These charts suggest sentiment is very bearish on the market for near term and suggest the current rally should continue. There is a good chance that the SPX may attempt to test the previous high near the 1325 range. Long SPX on 6/29 at 1272.87.
Bought GNBT at 1.74 on 7/10/06, biotech.
Bought Ivan (Invanhoe Energy) 4/13/06 at 2.55. Energy stock. Could go to Gap area (November 2003) near 5.40. We Bought ASTM at 1.92 on April 3. Biotech group.
To learn more on "Ord-Volume" visit www.ord-oracle.com.
Nasdaq Composite:
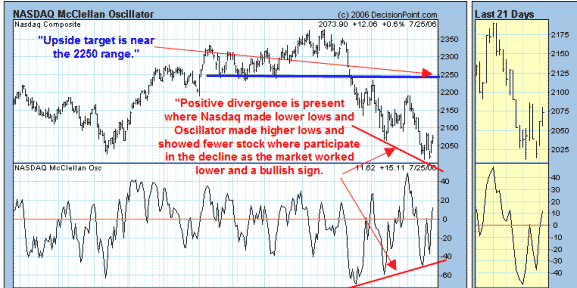
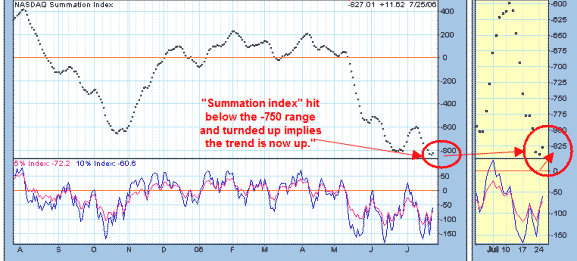
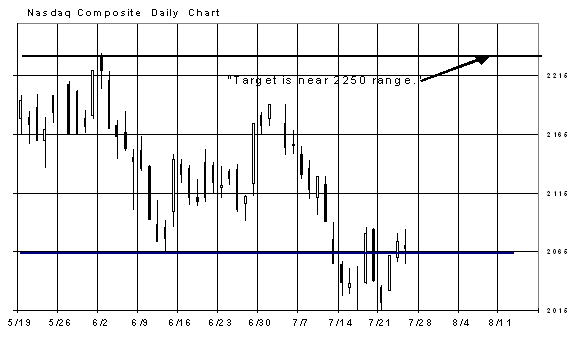
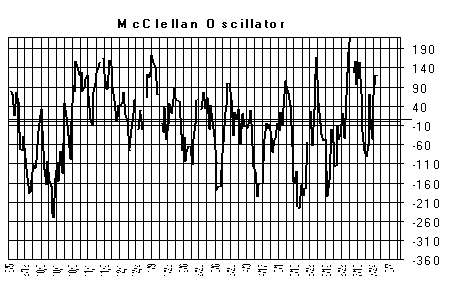
Below is displayed the Nasdaq daily chart with its McClellan Oscillator and Summation index, www.decisionpont.com. Intermediate term lows form on the Nasdaq when the Summation index trades below -750 and turns up. Notice on the June low the Nasdaq reached into the -750 range and turned up and triggered a bullish signal. It did the same thing at the July low and triggered another bullish signal. It’s rare that a double bottom forms on the Summation index below -750, but the current signal is bullish on the Summation index and the market should head higher. The Nasdaq has made “Positive Divergence” on the McClellan Oscillator going into the June and July lows. Notice on the chart that as the June low was approached, the Oscillator made higher lows then the previous low and Nasdaq made a lower low then the previous low. A similar situation occurred going into the current low. These types of condition are bullish and foretell a rally phase is about to begin. We are still expecting the 2250 range to be tested before the next decline begins. Covered Short position on Nasdaq for 8.4% gain on 6/12 and we are long on 6/28 at 2111.84.
"Timer Digest" has ranked Tim Ord as the #1 gold for one year ending 1/13/06.
Gold Market:
Long BGO (4/19/05) at 2.37. This trade is separate from our long-term position in BGO. We bought PMU (5/27/05) at .50 and bring our average price to .81. Long TRE at 2.55 on 11/1/05, sold at 3.39 on 12/3/05 for 33% gain. Long DROOY at 1.27 on 11/9/05, sold at 1.89 on 1/19/06 for 49% gain.
Bought AGT at .33 on 2/1/06, sold at .66 for 100% gain. Long TRE at 6.84 on 3/6/06. Bought GRZ at 6.30 on 5/19/06.
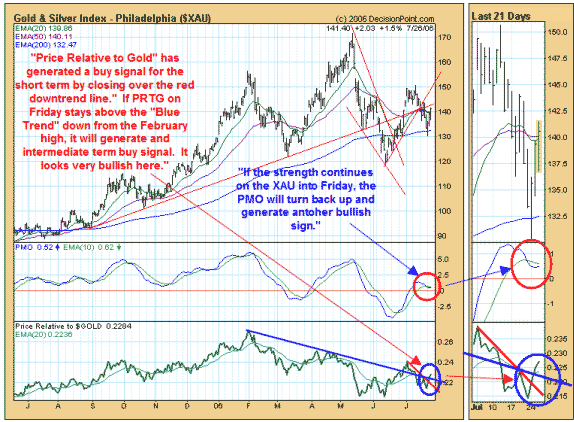
The “XAU” with its “Price Relative to Gold” chart is displayed below, courtesy of www.decisionpoint.com . “Price Relative to Gold” has cross over the “Red Trend Line” down from the early July high and has triggered a bullish short term signal. If “Price Relative to Gold” closes over the “Blue Trend Line” form the February high, it will generated an intermediate term buy signal. The picture looks real bullish right now. “Cumulative Net Cash Flow” on the “Rydex Precious Metals Fund” is also in a bullish area and supports a rally phase also. The month of September is most bullish month of the year in regard to Seasonality for Gold issues. We think the current low in the XAU will produce a rally that will last into late September to early October. When we get to that time frame we will take a look what will happen next.
We are watching VGZ (gold Issues) for possible buy on any pullback to support. We bought TGB at 1.84 on 3/27 by intraday email report. We bought TRE on 3/6 at 6.84 by intraday email report. We double our positions in BGO on (7/30/04) at 2.34 and we now have an average price at 2.70. Long NXG average of 2.26. We bought PMU (5/27/05) at .50 and bring our average price to .81.
The McClellan Oscillator closed today at +121 and overbought.
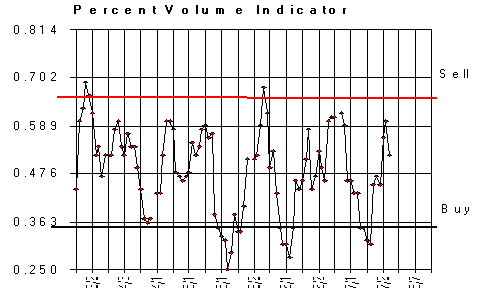
The “Percent Volume” Indicator closed .49 and in the neutral area.
The "5 day ARMS" closed today at 5.63 and short term neutral.
Conclusion: Long Nasdaq on 6/28 at 2111.84. Long SPX on 6/29 at 1272.87
Longer Term Trend monitoring purposes: Short SPX On 3/21/06 at 1297.23.