
www.toddmarketforecast.com
Available Mon- Friday after 6:00 p.m. Eastern, 3:00 Pacific.
DOW + 133 on 500 net advances
NASDAQ COMP. + 9 on 100 net advances
SHORT TERM TREND Bearish
INTERMEDIATE TERM TREND Bearish
Market Commentary
The Dow was up sharply, but for most indices the rally was far from impressive. Volume was the lowest in a week and one half. Breadth was lackluster. And the semiconductor index, SOX, was actually down for the session.
There were several reasons for the rally. In Europe the LIBOR rate dropped overnight. This is one of the important benchmarks for home mortgages. Also, McDonalds raised its dividend 50% and GM rallied sharply on indications of progress with the union over health care issues.
For our Jewish colleagues, Rosh Hashanah began after the close yesterday. We bring this up because there is an old bromide in the stock market that says buy Rosh Hashanah and sell Yom Kippur. These holidays are a little over a week apart and the in between period supposedly has a tendency to rally. Im indebted to my friend Yale Hirsch of the Stock Traders Almanac for pointing out that this little trick quit working decades ago.
Now its just the opposite. Since 1971, the period has been down 20 times and up 15 for an average return of minus 0.4%. What is more, it has been negative 7 out of the last 9 years. The new rule is sell Rosh Hashanah and buy Yom Kippur.
The Dow rallied right up to the level last seen on September 4, but couldnt break through. This level turned back the last rally attempt so we have to respect it as a potential resistance zone. Also important is the fact that the advance decline line looks even worse. The a-d line frequently foretells trouble.
All in all, we thought that there were enough negatives in todays action to stay short term bearish for at least one more session.
Gold fell back a bit more, but well stay bullish for now. Bonds fell rather sharply and we will move back to a sell.
NEWS AND FUNDAMENTALS:
Initial claims came in at 319,000, lower than the expected 325,000. On Friday we get another data dump led by retail sales and consumer sentiment.
BOTTOM LINE:
Our intermediate term systems are on a sell signal. Mutual fund investors are 100% in cash.
Short term ETF traders are in cash. Stay there for now.
OTHER MARKETS
We are moving back to a sell for bonds as of today September 13.
We are on a sell for the dollar and a buy for the Euro as of September 11.
We are on a buy for gold as of July 30.
We are on a buy for crude oil as of August 29.
We are long term bullish for all major world markets, including those of the U.S., Britain, Canada, Germany, France and Japan.
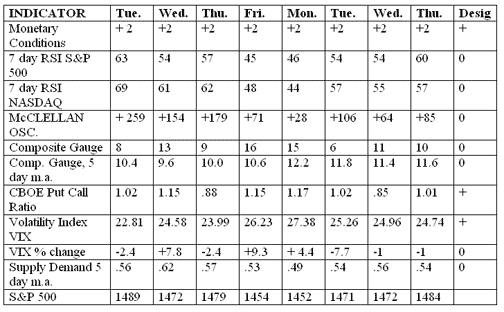
INDICATOR PARAMETERS
Monetary conditions (+2 means the Fed is actively dropping rates; +1 means a bias toward easing. 0 means neutral, -1 means a bias toward tightening, -2 means actively raising rates). RSI (30 or below is oversold, 70 or above is overbought). McClellan Oscillator ( minus 100 is oversold. Plus 100 is overbought). Composite Gauge five day m.a. (8.0 or below is overbought. 13.0 or above is oversold) Nova Ursa Ratio (1.00 or below is bullish 3.0 or above is a negative). CBOE Put Call Ratio ( Below .70 is a negative. Above .90 is a positive). Supply Demand 5 day m.a. (.45 or below is a positive. .80 or above is a negative). Volatility Index, VIX (low teens bearish, high teens bullish)


