

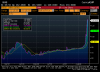
Would like some help..thoughts on this chart....
Started by
Getting-Smarter
, Jan 08 2008 12:32 PM
6 replies to this topic
#2

MacRo
-
- Traders-Talk User
- 421 posts
Member
Posted 08 January 2008 - 12:42 PM
Can't see it. Do you have a link or want to tell me what it is?
#3
Getting-Smarter
-
- Traders-Talk User
- 272 posts
Member
Posted 08 January 2008 - 12:47 PM
Can't see it. Do you have a link or want to tell me what it is?
Sorry, used wrong link. Here is correct one.
URL=http://imageshack.us]
 [/URL]
#4
ogm
-

- Traders-Talk User
- 13,780 posts
Member
Posted 08 January 2008 - 01:03 PM
Endless downtrend.
And considering that its the chart of MOT its even worse. I wouldn't touch it with a 10 foot pole.
#5
selecto
-

- Traders-Talk User
- 6,871 posts
Member
Posted 08 January 2008 - 01:04 PM
Your stuff (and some of mine) says weekly is on "don't buy, don't buy."
#6
beta
-

- Validating
- 4,384 posts
lasergirl
Posted 08 January 2008 - 01:24 PM
Here's my .02: dont bother wasting time on old-tech momo's. Charts will oscillate in a range for years (ex: semis) or trend to zero. Most of these earlier tech high-fliers have been dead-money since '00 (ex: QCOM), esp. hardware sectors. AAPL is an exception.
Besides, "long-term tech investment" is an oxymoron, since these are change-focused industries and perpetual innovation destroys incumbents.
Tech is always a trade (not an investment), and only cutting-edge sectors merit the $$$ and risk (ex: VMW, GOOG). Or invest in a tech mutual fund. JMHO.
Besides, "long-term tech investment" is an oxymoron, since these are change-focused industries and perpetual innovation destroys incumbents.
Tech is always a trade (not an investment), and only cutting-edge sectors merit the $$$ and risk (ex: VMW, GOOG). Or invest in a tech mutual fund. JMHO.
"Daytrading -- An Extreme Sport !"
#7
vitaminm
-

- Traders-Talk User
- 6,701 posts
Member
Posted 08 January 2008 - 03:14 PM
ctrend
mot..........13-14..........may follow market.........one may buy this leap call
Jan 09 VMAAC.X 2.17 0.11 2.16 2.19 93 24,981.........6-7calls=100shares
Edited by vitaminm, 08 January 2008 - 03:19 PM.
vitaminm


