
One of my favorite technical analysis bloggers is Brett Steenbarger at http://traderfeed.blogspot.com/
Last year he posted this study based on the Equity Put/Call Ratio.
http://traderfeed.bl...tio-signal.html
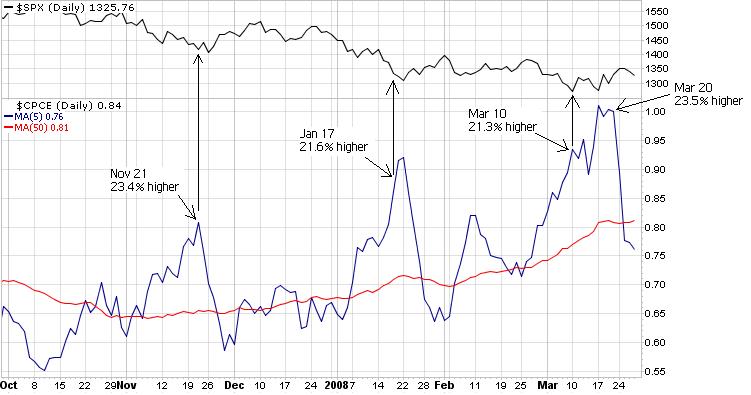
Ever since I've been using it as a signal for long entries. I made this chart to show how SPX acts in the weeks after this signal. On the chart I noted the first day of each cycle that the 5 day MA exceeded the 50 day MA by at least 20%. On both of the last two cycles (11/21 and 01/17) SPX lows came within one week of the signal and SPX closing price remained above those lows for at least six weeks after the 5 day MA dropped below the 20% mark. The 5 day just dropped below the 20% mark on Monday. So the way I see it, there's very little downside risk for the next 5 weeks.
Apollo


