Jump to content


Photo

Decode the 11 week and 9 month cycle


  • Please log in to reply
8 replies to this topic

#1 stanley

stanley

    Member

  • Traders-Talk User
  • 167 posts

Posted 30 March 2008 - 10:42 PM

Aug 10 2007, 01:51 PM
Those who desire to see the smelt through deep water will soon get exhausted
Posted Image
( Water Lilies at Giverny, 1908 by Claude Monet )

Mar 27 2008, 09:16 AM
The chart pattern is rich of short term harmonics near the major Peak/Trough. Since these time variant harmonics in nature is not in synchronization mode, an aggressive probing may invite frustration.

I feel the pulling, may I pull…..
Posted Image

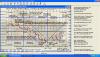
Two obvious cycles, apparent 109 trading days and apparent 466 trading days can be identified in the charts.

[A] 11 calendar weeks
109 trading days = (1/3) * 100 * PI
Since each year has 251 trading days, 109 trading days is very close to two 11 calendar weeks
(11/52) * 251 * 2 = 106 trading days
It marked the January low (01/23), off one day. Its Fibonacci 1.382 Time zone expected a Peak/Trough on 03/20-03/24, actual low marked on 03/17.

[B] 9 calendar months
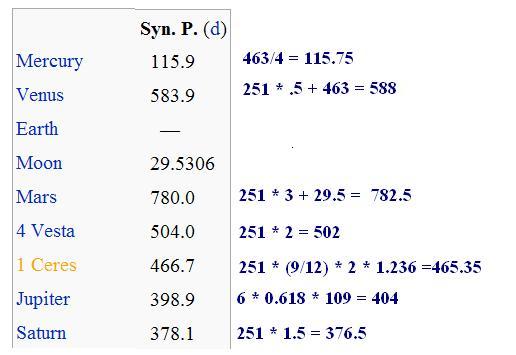
466 trading days = 1.236 * 377 ( A Fibonacci number), the observed cycle are 463 and 462 trading days.
9 calendar months has the following relation with the 465 trading days
(9/12) * 251 * 2 * 1.236 = 465

Mar 21 2008, 11:19 AM
The low (1256.98) marked on March 17 looks deceptive.

Wave “4?” 02/01 - 1,396.02
Wave “5?” 03/17 - 1,256.98 [ 0.786 out of Wave “1?” from 1396.02 maps to 1262.41 ]

A 0.786 movement in terms of Wave “1?” put Wave “5?” at 1262.41. The deviation is 5.43 points from the actual low 1256.98. There is insignificant evidence that Wave “5?” has been truncated. Timing wise, the 1.382 * 109 trading days cycle (see chart below) maps to 03/20-03/24. No matter index moves up continuously after 03/24 or reverses down on 03/24, the Fibonacci 1.382 time zone ratio only marks a secondary event.

Posted Image
large size

Here is the Fibonacci numbers: 1, 2, 3, 5, 8, 13, 21, 34, 55, 89, 144, 233, 377, 610, 987, 1597, 2584, 4181, 6765........
There is lots information in these numbers.
According to Andre Gratian there is a 9-mo cycle which is due in April ( link ). In average, each year has 251 trading days. 9 months cycle is equivalent to 188.25 trading days. 188.25 * 2 rounds to Fibonacci number 377 (off 0.5).

376.5 * 1.236 = 465.3 trading days.

There are two obvious 465.3 trading days cycle in both S&P and NASDAQ.
Refer to the chart:
10/10/2002-08/13/2004 – 463 trading days
08/13/2004-06/14/2006 – 462 trading days
Next 462/463 trading days cycle maps to April 15/16. Whether it is an intermediate high or low is hard to sense at this moment, but we may use Gauges: 1248-1257 to anticipate the low still ahead and 1378-1380 to confirm the near term low has passed. 1332 (0.236) is an early sign that index is moving towards the higher side, a 0.5 retracement (1576:1256) can reach 1416; Time wll tell whcih frame index rides.
Posted Image
large size


Mar 25 2008, 11:59 AM
SPX
Day's Range: 1341.21 - 1357.47
52wk Range: 1,256.98 - 1,576.09

Based on (1)(2), 1355/1356 becomes the critical pivot, resistance 1379, support 1332, 1310,1290. A milder retreat (> 1332) implies bullish movements ahead

(1) large frame

11-Oct-07 1,576.09 High
17-Mar-08 1,256.98 Low

Frame [1576.09:1256.98]
0.236 = 1332.29 an early sign that index is moving higher
0.382 = 1378.88 to confirm the near term low has passed

Mean of (1332.29+1378.88) = 1355.59

0.500 = 1416.54
0.618 = 1454.19


(2) local frame

1-Feb-08 1,396.02 Wave 5? starting point
17-Mar-08 1,256.98 Low

Frame [1396.02:1256.98]
0.707 = 1355.28 (Half power 0.707 * 0.707 = 0.5)

#2 oextrader

oextrader

    Member

  • Traders-Talk User
  • 511 posts

Posted 30 March 2008 - 11:26 PM

Thank you for your excellent analysis, one NYA system have is within 20 NYA points of equaling its largest winning short trade. so I suspect we may have made a low or will make one today, so the odds may be good we rally after today. Rick

#3 stanley

stanley

    Member

  • Traders-Talk User
  • 167 posts

Posted 30 March 2008 - 11:31 PM

In Andre Gratian 03/23 commentary, he wrote: "9-mo Hurst cycle is also due in April-May. So we may not be ready to get back into a firm uptrend until all of these are behind us."
This is not difficult to realize, there were two harmonic low (463 trading day cycle) can be observed in the chart 06/14/06 and 07/18/06
assume the 463/462 trading day cycle will duplicate itself one more time, then:
06/14/06 maps to 04/15-16/08 and 07/18/06 maps to 05/15-16/08. The rich harmonics near these 463 trading day cycles semars the prediction quality. Therefore, the exact context can only be realized after the facts.
Posted Image
large size

Edited by stanely, 30 March 2008 - 11:37 PM.


#4 Kimston

Kimston

    Member

  • Traders-Talk User
  • 604 posts

Posted 30 March 2008 - 11:53 PM

I posted this 463 trading day cycle a few weeks back, which is looking at April 17th timeframe for a turn.
http://www.traders-t...mp;#entry357311

Do you have any cycle work pointing to anything important in November?

Kimston

#5 stanley

stanley

    Member

  • Traders-Talk User
  • 167 posts

Posted 31 March 2008 - 01:11 AM

I posted this 463 trading day cycle a few weeks back, which is looking at April 17th timeframe for a turn.
http://www.traders-t...mp;#entry357311

Do you have any cycle work pointing to anything important in November?

Kimston

Kimston,
Glad you found that 463 trading day cycle. Since I believe these cycles (463/109) are time variant and will merge with other cycles eventually or dampen out naturally, so I did not extend the scope beyond this coming May. This is a fascinating topic, here is another old work I did, you can see there are others different length cycles

Oct 20 2007, 09:10 PM
.... We may process the same set of data differently. As each year has 251 trading days plus/minus a few days. How many trading days in a 54 months period?

(54 months/12 months) * 251 = 1129 trading days.

Let's check Fibonacci numbers ..... 0, 1, 1, 2, 3, 5, 8, 13, 21, 34, 55, 89, 144, 233, 377, 610, 987, 1597, 2584, 4181, 6765, 10946, 17711, 28657, 46368, 75025, 121393, ... ( http://en.wikipedia....ibonacci_number )

Pick 1597, and 1597 * 0.707 = 1129 !!! (Note: 0.707 is the famous half power point, 0.707 * 0.707 = 0.5)

In the past few months i have posted quite a few Fibonacci Time zone posts. The essence is that a cycle can be realigned with nearest Peak/Trough with integers of Pi (3.14159265),
thus:
1200 trading days (= 3.82 * 100 * PI) since 10/10/2002 is 07/19/2007 (07/19 Nas peak 2,724.74)
1257 trading days (= 4.00 * 100 * PI) since 10/10/2002 is 10/08/2007 (actual high date 10/11 Nas peak 2,834.00)
Posted Image


Edited by stanely, 31 March 2008 - 01:17 AM.


#6 Funky Monk

Funky Monk

    Member

  • Traders-Talk User
  • 406 posts

Posted 31 March 2008 - 02:09 AM

great work stanely, thanks for sharing regarding the 461-462 day cycle...... one of my 'old teachers', brad f. cowan has a cycle that has nailed those same lows with stunning accuracy.......... the # of days varies because he uses planetary cycles so retro/sidereal whatever motion changes the day counts (sometimes), sympathetic resonance, or something like that anyways......bradley's cycle, coming foreward from the 6-13-06 low (exact)....hits today...... that's right, today.......(451 days, this time) so we shall see brad is the only 'cycle guy' that i ever stuck with, i ditched the rest.....except for larry t, of course. FWIW

#7 blustar

blustar

    blustar

  • Traders-Talk User
  • 6,574 posts

Posted 31 March 2008 - 08:33 AM

The 463 day cycle I have noticed and dubbed it the 22 month cycle. Has been dominant for quite a few years, I believe since 1997. 6 22 month cycles ago had us bottoming in April 1997 I believe.

Blessings,


blu

BluStar Market Insights Subscriptions


#8 stanley

stanley

    Member

  • Traders-Talk User
  • 167 posts

Posted 31 March 2008 - 11:50 AM

great work stanely, thanks for sharing

regarding the 461-462 day cycle......
one of my 'old teachers', brad f. cowan
has a cycle that has nailed those same
lows with stunning accuracy..........
the # of days varies because he uses
planetary cycles so retro/sidereal whatever
motion changes the day counts (sometimes),
sympathetic resonance, or something like
that
anyways......bradley's cycle, coming foreward
from the 6-13-06 low (exact)....hits today......
that's right, today.......(451 days, this time)

so we shall see

brad is the only 'cycle guy' that i ever stuck with,
i ditched the rest.....except for larry t, of course.

FWIW


Monk,
Thanks,

the 109 trading day cycle and 463 trading day cycle also link with Planetary synodic period. Here is the decoded table:

one year has in average 251 trading days.

http://en.wikipedia..../Orbital_period
The synodic period is the time that it takes for the object to reappear at the same point in the sky, relative to the Sun, as observed from Earth; i.e. returns to the same elongation (and planetary phase). This is the time that elapses between two successive conjunctions with the Sun and is the object's Earth-apparent orbital period. The synodic period differs from the sidereal period since Earth itself revolves around the Sun.

cycle.JPG

Edited by stanely, 31 March 2008 - 11:59 AM.


#9 hawkeyefan

hawkeyefan

    Member

  • Traders-Talk User
  • 376 posts

Posted 31 March 2008 - 12:36 PM

great work stanely, thanks for sharing

regarding the 461-462 day cycle......
one of my 'old teachers', brad f. cowan
has a cycle that has nailed those same
lows with stunning accuracy..........
the # of days varies because he uses
planetary cycles so retro/sidereal whatever
motion changes the day counts (sometimes),
sympathetic resonance, or something like
that
anyways......bradley's cycle, coming foreward
from the 6-13-06 low (exact)....hits today......
that's right, today.......(451 days, this time)

so we shall se

brad is the only 'cycle guy' that i ever stuck with,
i ditched the rest.....except for larry t, of course.

FWIW


So far so good. Nice call.

For me short term cycles may be changing, which I have always thought was a sign of early change of trend for the market.