
ISEE Oscillator
Started by
linrom1
, Apr 27 2008 10:51 AM
3 replies to this topic
#1

linrom1
-
- Traders-Talk User
- 5,009 posts
Member
Posted 27 April 2008 - 10:51 AM
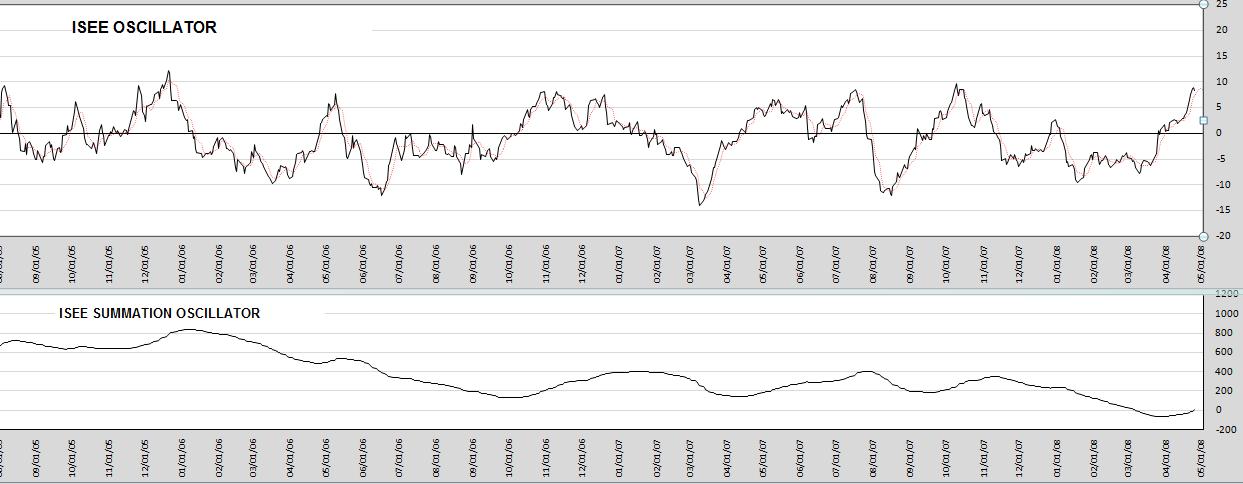
ISEE Index of call/puts ratio is rolling over. It is unlikely that it will go much higher without something that'll cause it to ramp up. While ISEE Summation could continue to inch up, it does not look like it is going to get out of the basement.
#2
Douglas
-

- Traders-Talk User
- 2,165 posts
Member
Posted 27 April 2008 - 11:42 AM
Thanks for posting this chart. Am I reading this correctly, you are expecting a sell off short term?
#3
Douglas
-
- Traders-Talk User
- 2,165 posts
Member
Posted 27 April 2008 - 11:50 AM
Where can you find the ISEE Oscillator or the daily data for it on the web? Thanks again.
#4
linrom1
-
- Traders-Talk User
- 5,009 posts
Member
Posted 27 April 2008 - 12:55 PM
Thanks for posting this chart. Am I reading this correctly, you are expecting a sell off short term?
The longer trend shows steady put buying which is why the ISEE Summation is declining. In the shorter term, there is heavy counter trend call buying and heavier put buying that coincides with market turns. The recent bottom occurred on 1/17/08; prior to that it was the top on 10/9/07 and bottom on 8/15/07.
ISEE data is available at ISEE. Information how to create oscillators can be found at Stockcharts.Link


