
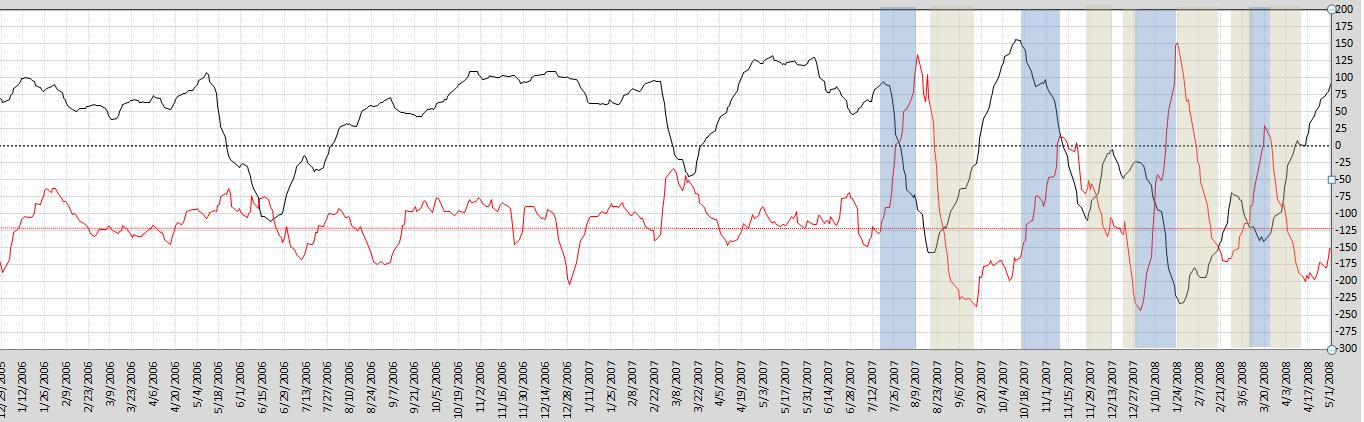
During bull markets, behavior of volume and price is constrained around its zero line. Large price fluctuations are not accompanied by similar movements in volume. While volume always rises in bull market, the change is gradual and imperceptible to moving averages. It is only evident by looking at long term trends. This behavior is very much different in bear markets as both price and volume can oscillate wildly in same or opposite direction by degree of several standard deviations away from its average line. In this chart, volume is represnted by red color, and price by black color.
Since the third week in January price has been steadily going up, while volume has been declining. The blue highlighted areas show rising volume and falling price--clearly periods of wholesale liquidation. The amber-gray highlighted areas show falling volume and rising price. In general, rising volume has corresponded to declining market prices while falling volume has corresponded to rising market prices.
In secular bear markets, falling volume will be accompanied by falling price----but this is not the case yet
Attached Thumbnails
Edited by linrom1, 03 May 2008 - 02:59 PM.


