To october of last year.
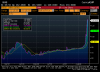
Look at the price pattern from august low to oct top.
Look at sentiment data via AAII.
Look at equity p/c or 5 day moving average.
Look at deteriorating internals.
Look at nasdaq vs nyse volume ratios.
Look at AAPL.
Look at $ value of calls - $ value of puts opened last week.
Even the same people seem to be short now as back then.
Only difference is, financial crisis already happened, and the fed fixed it. Or did they?
Remember, most of sub-prime resets in a month from now. Not 2 months ago.

I can't tell you whether it will drop today or tomorrow
Started by
dcengr
, May 06 2008 02:46 PM
5 replies to this topic
#1

dcengr
-
- Traders-Talk User
- 13,391 posts
Member
Posted 06 May 2008 - 02:46 PM
Qui custodiet ipsos custodes?
#2
MacRo
-
- Traders-Talk User
- 421 posts
Member
Posted 06 May 2008 - 03:18 PM
Didn't you see WSJ today? Subprime/Housing/Credit-Contraction Crisis is over. I am just trying to re-live past glory
#5
dowdeva
-

- Traders-Talk User
- 525 posts
Member
Posted 06 May 2008 - 03:59 PM
In Japanese candlestick charting, 9 candles in a row is considered a matured rally. Not sure if it also applies to renko charts, but this rally is already at 7 boxex.
Deva
#6
selecto
-

- Traders-Talk User
- 6,871 posts
Member
Posted 06 May 2008 - 04:13 PM
You can set the boxes for any size.


