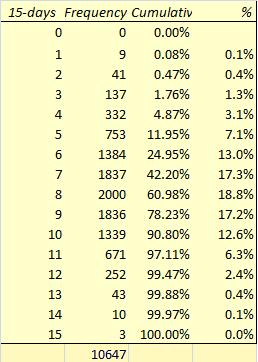
The table below shows consecutive trading 15-day moving average distribution since 1966 on NYSE Composite. During the last three days it stood at 11 which is less than 3 percentile. If tomorrow is another up day on NYA, than odds of Thursday being also up are infinitesimal. The last time NYA had 12 out of 15 up days was on 4/23/07.
Edited by linrom1, 06 May 2008 - 08:54 PM.