http://www.cnbc.com/id/26391732
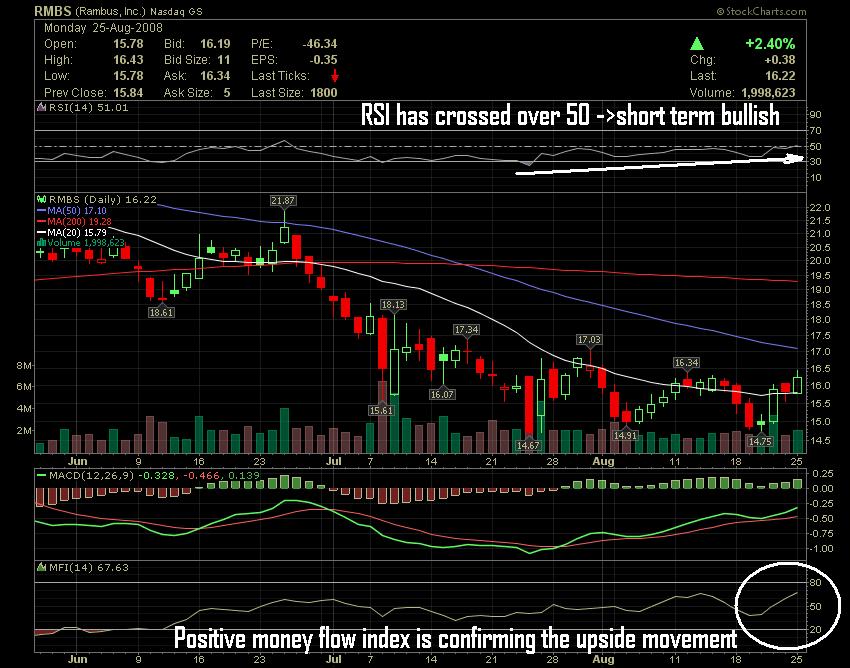
Looking at the daily chart, the stock looks like is close to attempting another breakout. Although the stock didn't perform well this year, we start to see now some signals of rebound as the technical chart shows positive momentum is back. RSI has crossed over 50 ->short term bullish. Positive money flow index is confirming the upside movement. The stock is also back above 20 day moving average showing positive momentum. Although both 50 day and 200 day moving averages are falling, the rising KD shows the stock is probably now in recovery mode. Stay tuned on it.