http://stockcharts.com/c-sc/sc?s=$OEX&p=60&yr=0&mn=10&dy=3&i=p42829663700&a=81733615&r=2986.png

OEX
Started by
eminimee
, Aug 28 2008 08:44 AM
6 replies to this topic
#1

eminimee
-
- TT Member
- 14,307 posts
I don't care who's fur is flying...
Posted 28 August 2008 - 08:44 AM
#2
skott
-

- Traders-Talk User
- 4,712 posts
Member
Posted 28 August 2008 - 11:27 AM
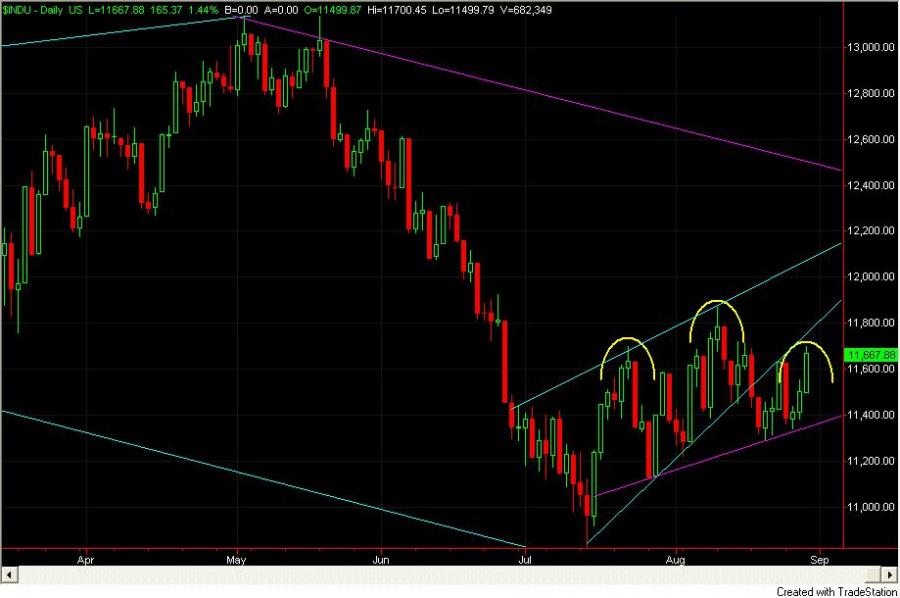
TP, would you say this count is invalidated because the d wave within the triangle has gone as high as it has? I am unsure about throwovers.......my thinking is it is ok if it comes at the end of a structure?
#3
eminimee
-
- TT Member
- 14,307 posts
I don't care who's fur is flying...
Posted 28 August 2008 - 12:47 PM
Triangle idea is busted...not sure what's going on here right now....we are going up on fumes....
#4
skott
-
- Traders-Talk User
- 4,712 posts
Member
Posted 28 August 2008 - 01:10 PM
May just be another retest of the broken trendline. This is a chart of the Dow, though, and not the OEX

#5
skott
-
- Traders-Talk User
- 4,712 posts
Member
Posted 28 August 2008 - 01:59 PM
This is looking like a strong possibility

#6
StillLearnin
-

- Traders-Talk User
- 1,200 posts
Member
Posted 28 August 2008 - 02:03 PM
Tea,
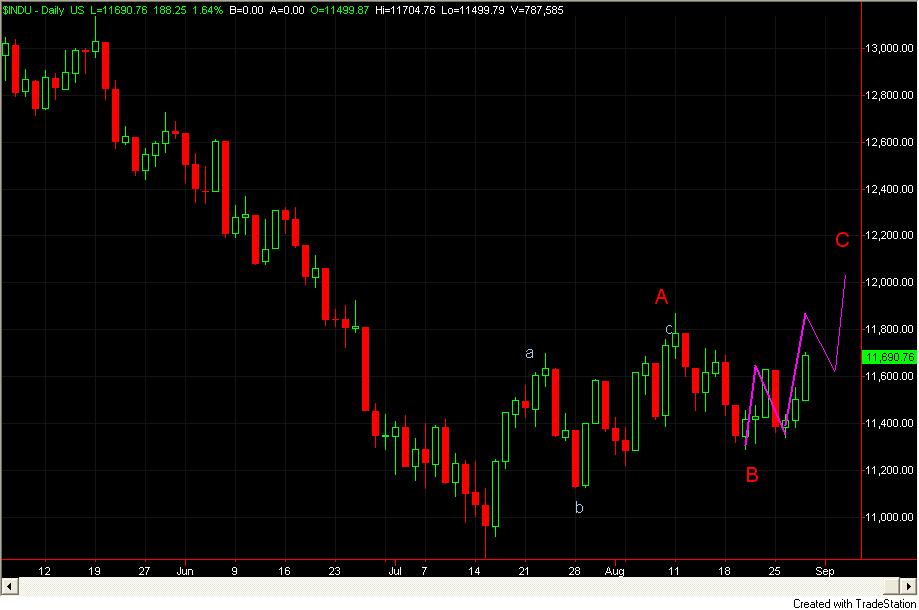
What about a B wave running triangle that broke out today where A was 1200-1291 and B was a running tri? If so A=C at 1354 which is very near 89 week EMA and 200 ema on daily...
SL?
#7
eminimee
-
- TT Member
- 14,307 posts
I don't care who's fur is flying...
Posted 29 August 2008 - 05:29 AM
Possible SL..or the new tri I just put on that chart. Either way....gut says OEX will hit the 615/620 area...not sure how we get there....again....below 1260 before a new high for this move and it's over me thinks...


