
IT buy signal
Started by
VolPivots
, Sep 29 2008 12:54 AM
4 replies to this topic
#1

VolPivots
-
- Chartist
- 3,203 posts
Member
Posted 29 September 2008 - 12:54 AM
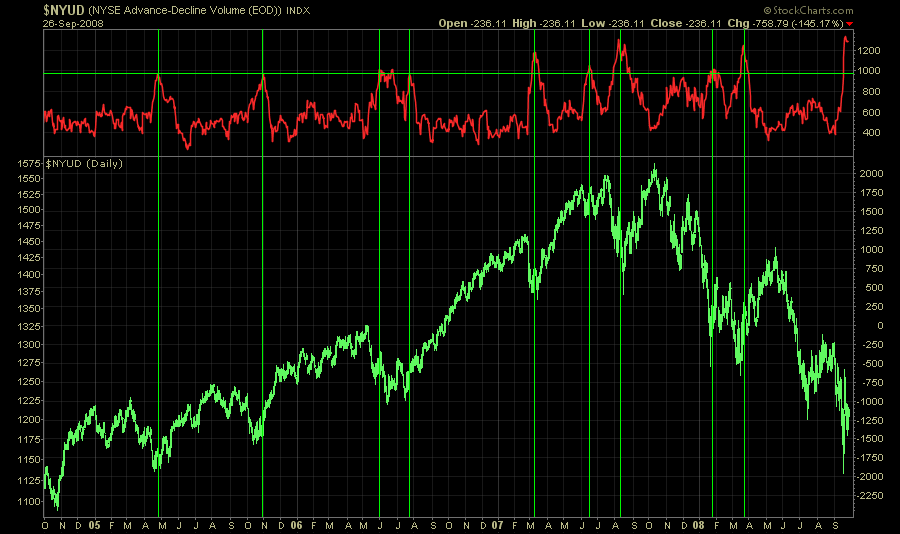
ignoring the fundys and gloomying earnings season, one pretty darn reliable chart in my arsenal (there's plenty of other TA charts that support) suggests reward/risk is very favorable.
VST, ideally some backing/filling 1st into Wed/Thurs....I do think that 1170 gets tested here in the coming several days followed by a bounce and 1 more possible downwave....
#2
ogm
-

- Traders-Talk User
- 13,780 posts
Member
Posted 29 September 2008 - 05:39 AM
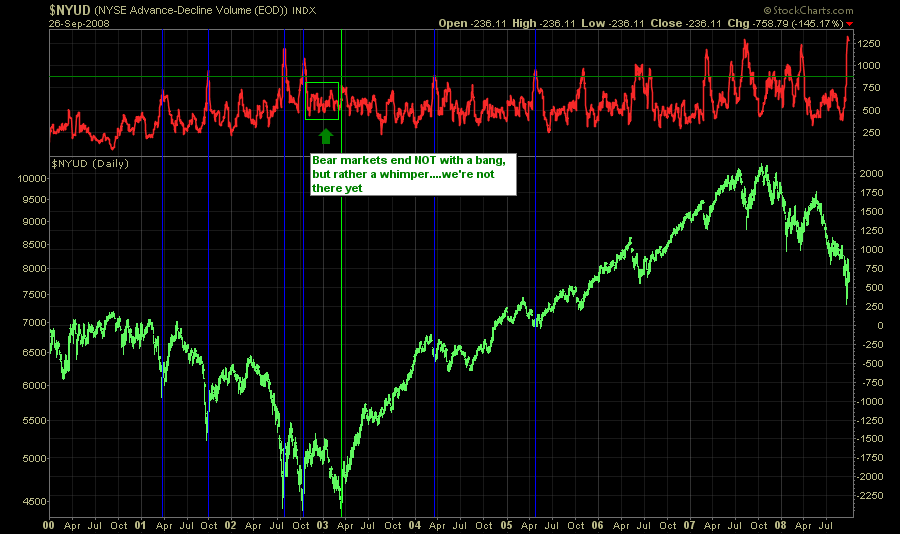
What is the mystery indicator ? Can you posty how it worked in the 2000-2003 decline ?
I do think we're near some sort of a low with a relief move up. I'm a bit less bearish then I was a few days ago. Then again I can be wrong and we're going into freefall, like I thought originaly  But I've decided not to bet on that for now.
There is a lot of fear in the market and with the quarter end book clearing and deleveraging under way, we should start getting some relief after its over, IMO. Nothing spectacular, just some kind of slow grind up as selling pressure drops.
The ban on financial shorts may be screwing the internals picture into positive divergences, though.
But I've decided not to bet on that for now.
There is a lot of fear in the market and with the quarter end book clearing and deleveraging under way, we should start getting some relief after its over, IMO. Nothing spectacular, just some kind of slow grind up as selling pressure drops.
The ban on financial shorts may be screwing the internals picture into positive divergences, though.
Edited by ogm, 29 September 2008 - 05:40 AM.
#3
ogm
-
- Traders-Talk User
- 13,780 posts
Member
Posted 29 September 2008 - 06:20 AM
Lol.. sorry, its NYUD ... I'm was barely awake and didn't see the label
Edited by ogm, 29 September 2008 - 06:20 AM.
#4
VolPivots
-
- Chartist
- 3,203 posts
Member
Posted 29 September 2008 - 07:34 AM
ogm
not exactly NYUD but that's the input used to generate the oscillator.....just think of it as another volatility indicator  here it is again longer-term with NYSE plotting instead of SPX
here it is again longer-term with NYSE plotting instead of SPX
Attached Thumbnails
Edited by marketneutral, 29 September 2008 - 07:35 AM.
#5
OEXCHAOS
-

- Admin
- 22,595 posts
Mark S. Young
Posted 29 September 2008 - 07:52 AM
Longer term Stochastic, too has turned back up after a buy. That's usually good for a rally too.
But first it has to stop going down.

Mark S Young
Wall Street Sentiment
Get a free trial here:
https://book.stripe....1aut29V5edgrS03
You can now follow me on X


