http://stockcharts.com/c-sc/sc?s=$TICK&p=D&yr=3&mn=0&dy=0&i=p51092054391&r=9143.png

Bottom is not in
Started by
traderpaul
, Oct 22 2008 06:48 PM
3 replies to this topic
#1

traderpaul
-
- Traders-Talk User
- 6,034 posts
Member
Posted 22 October 2008 - 06:48 PM
"Inflation is taking place now. Prices may not appear to be rising because they are making packaging smaller. " Rickoshay
#2
TheArchitect
-

- TT Member+
- 1,659 posts
Member
Posted 22 October 2008 - 06:57 PM
how can you make such a comment based on a 3 yr chart?
#3
traderpaul
-
- Traders-Talk User
- 6,034 posts
Member
Posted 22 October 2008 - 07:03 PM
how can you make such a comment based on a 3 yr chart?
In a bull market the tick stays above 400. In a bear market she stays below the 400 line.....Notice i did not use any trend lines to influence my chart reading.....You have to be a chartist to get the message of this chart.
"Inflation is taking place now. Prices may not appear to be rising because they are making packaging smaller. " Rickoshay
#4
TheArchitect
-
- TT Member+
- 1,659 posts
Member
Posted 22 October 2008 - 07:59 PM
.....You have to be a chartist to get the message of this chart.
well i'm a terrible chartist...
 ... still not seeing it... below 400?
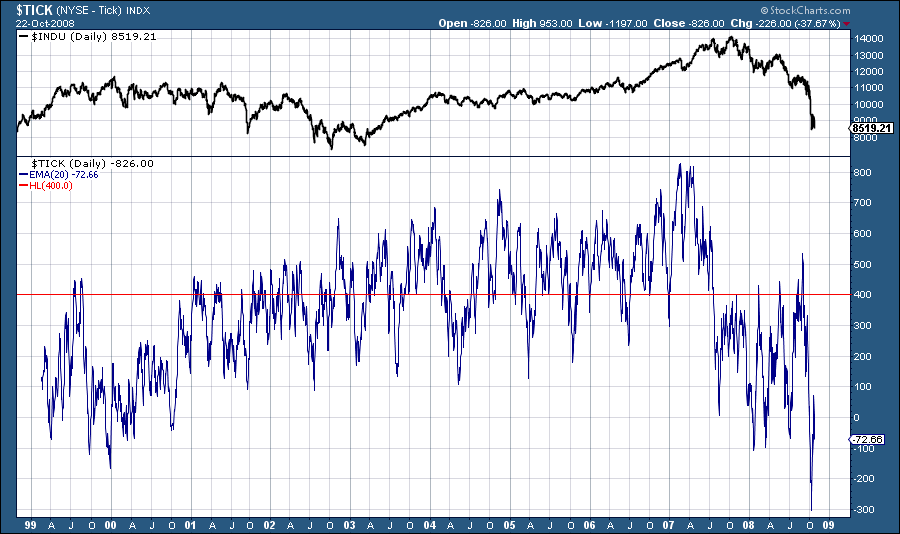


