SPX
Started by
CLK
, Dec 28 2008 03:32 PM
6 replies to this topic
#1

CLK
-
- Traders-Talk User
- 10,823 posts
Member
Posted 28 December 2008 - 03:32 PM
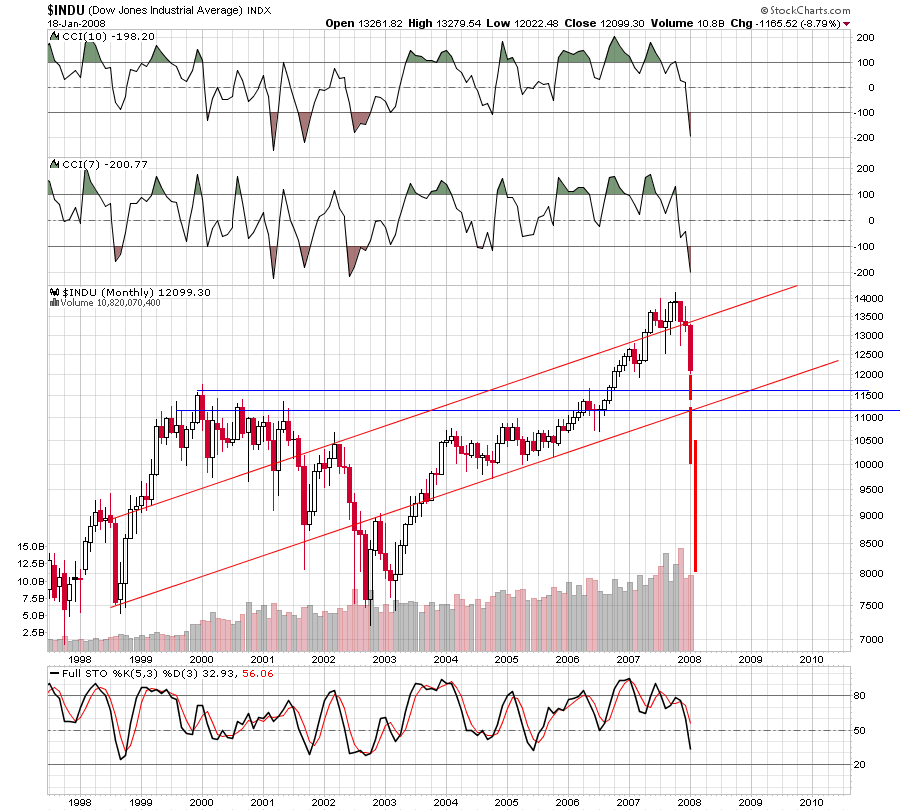
Here is what I think for 2009.
Either straight down or have a running correction within the red channel
to work off the oversold indicators.
This just doesn't look like any bottom formation to me.
Yeah, if you look at a 1 year chart with landscape setting it does, but does a
poor job of showing the swiftness and magnatude of the drop.
We have had very little bounce, looks more like consolidation.
#2
relax
-

- Traders-Talk User
- 2,224 posts
Member
Posted 28 December 2008 - 04:06 PM
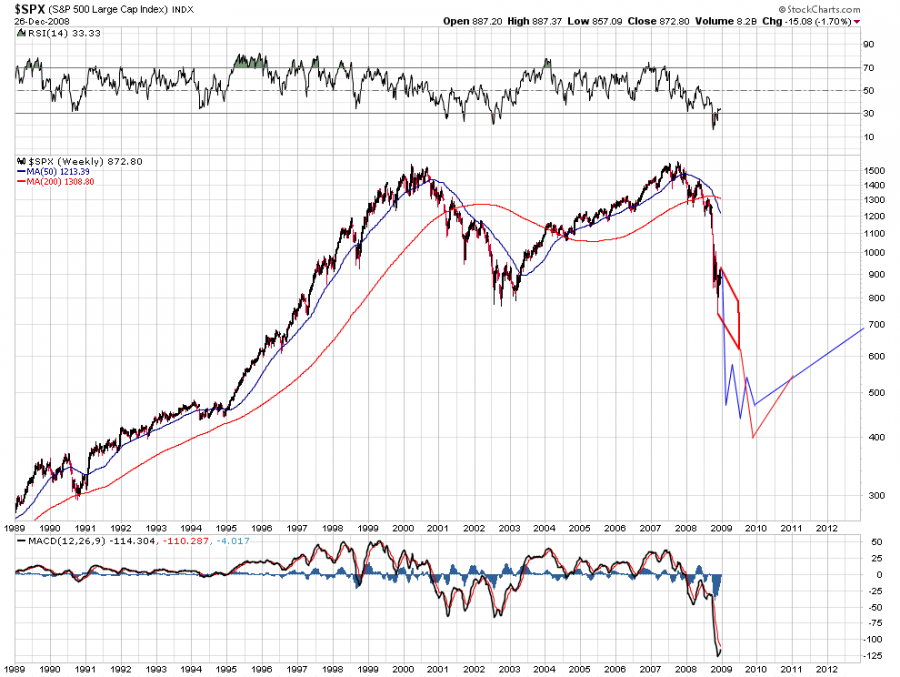
sorry but i see nothing predictive in the chart
i can't deliver anything predictive either
but what the market does the coming weeks is really impossible to read off the charts, as we are coming out of low volume weeks
remember during thanksgiving week when everybody was talking of 1000-1100
low volume should make one humble and just ready to react
i agree that this does not look like a bottom, but just don't think it makes for a case of predicting the coming weeks
the fact is that there are some crazy guys out there, especially during ES night hours, and these guys can make anything happen
and they will make anything happen
#3
humble1
-

- Traders-Talk User
- 5,959 posts
Member
Posted 28 December 2008 - 04:11 PM
i am curious how your Price target of mid spx 400 is calculated. please explain ...
TIA!

#4
relax
-
- Traders-Talk User
- 2,224 posts
Member
Posted 28 December 2008 - 04:41 PM
targets are so easy, always one method
fib extension
A B C pattern for OEX, maybe a 1.5 or a 1.618 extension will do it
#5
VolPivots
-

- Chartist
- 3,203 posts
Member
Posted 28 December 2008 - 04:51 PM
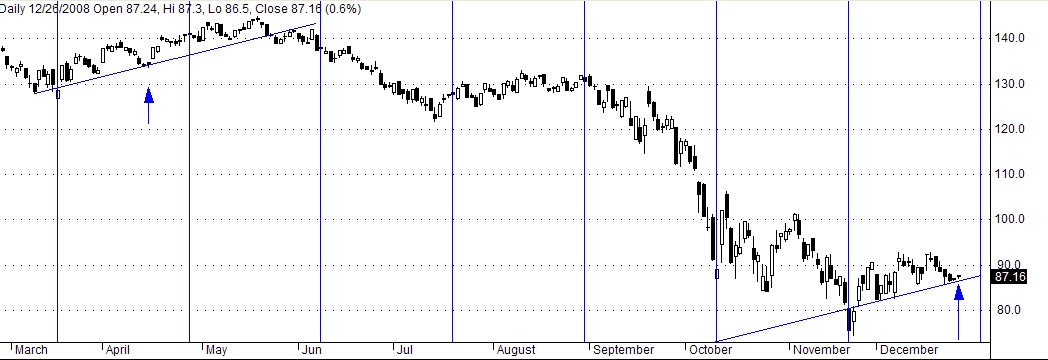
Looking at the daily, looks a lot like the action into mid-May.....a premium-killing grind up into an IT top.....this is the easy entry trade with obvious stopout levels.
I do have a different fractal setup on a 30min that has us going down into 1/2 or 1/5, closing basis....if this is the destiny, should top out 1st half of tomorrow followed by choppy sideways down series of lower highs, lower lows which culminates in a violent down move 2nd half of the week into early next.
G/L in 2009!
Attached Thumbnails
#6
humble1
-
- Traders-Talk User
- 5,959 posts
Member
Posted 28 December 2008 - 04:58 PM
relax (may i call you "my friend"?):
i wish it was that simple. even with fibo projections, there are the anchor points and the underlying "counts" and the subjectivity factor. and then there are the other methods.
#7
CLK
-
- Traders-Talk User
- 10,823 posts
Member
Posted 28 December 2008 - 05:09 PM
relax .... humble1,
I'm going by price patterns only. If you look at big quick drops on the intraday
charts, they usually have a consolidation then another drop before putting in
a bottom.
The put/call looks bearish to me though.
That said, I posted this at the beginning of the year. I got the direction right but
was thinking too much in terms of crash instead of bear market.