
SPX - E Wave Count
Started by
Swiss Trader
, Dec 31 2008 05:00 AM
5 replies to this topic
#1

Swiss Trader
-
- Traders-Talk User
- 1,264 posts
Member
Posted 31 December 2008 - 05:00 AM
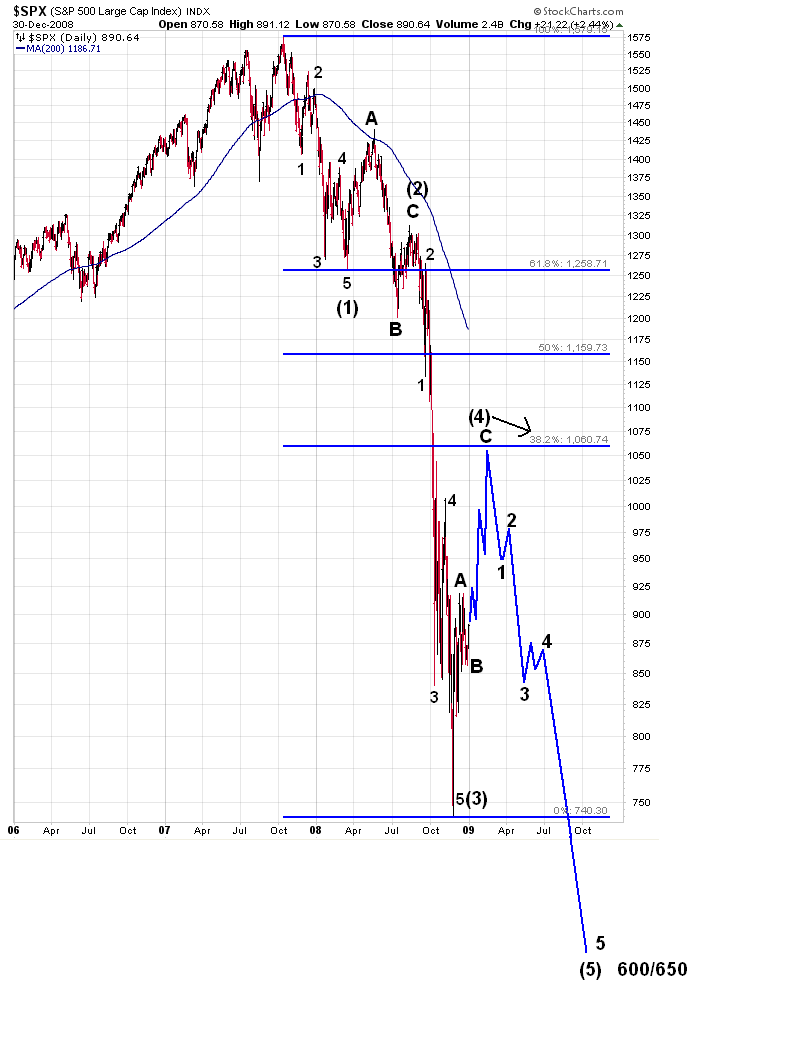
Rally and collapse...

#2
humble1
-

- Traders-Talk User
- 5,959 posts
Member
Posted 31 December 2008 - 05:37 AM
nice chart and a good gap lesson, with that splendid measuring gap at spx 1100 PLUS the perfect wave1 low extension to the final low of 741.
the ewave problem with the 1576-741 is that it is SO completely textbook that it invites the deadly trap of subjectivity. if it IS a completed ABC of a larger C (and your 1-2-3 count could be just as easily interpreted in that manner), then what we have coming will probably not be very much related to the left side of the chart, except for fakeouts.
and the .382 fibo retrace does not even have a left side argument in its favor, while spx 1100 and spx 1257 DO have a case!
Edited by humble1, 31 December 2008 - 05:42 AM.
#3
Swiss Trader
-
- Traders-Talk User
- 1,264 posts
Member
Posted 31 December 2008 - 07:11 AM
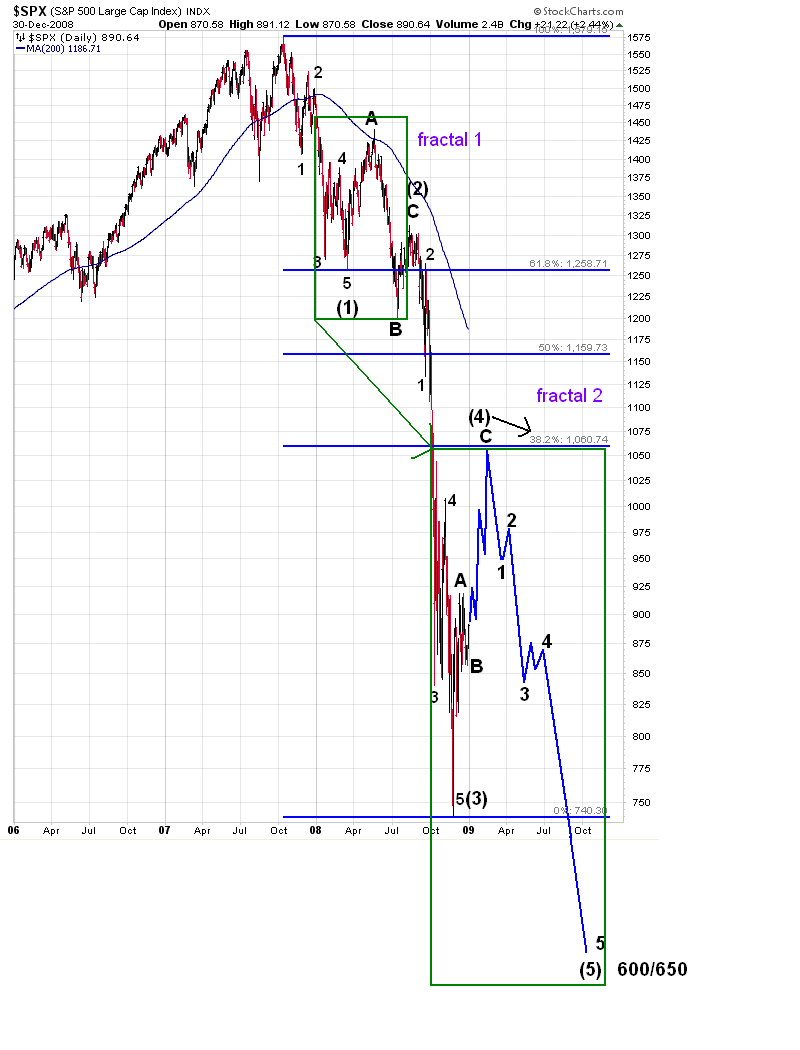
We could have the same fractal....
Attached Thumbnails
#4
eminimee
-

- TT Member
- 14,307 posts
I don't care who's fur is flying...
Posted 31 December 2008 - 08:26 AM
I had taken this off my list...but with the holiday chop....I'm putting it back on as a possibility..
http://stockcharts.com/c-sc/sc?s=$OEX&p=D&yr=1&mn=2&dy=0&i=p12339330426&a=29903483&r=6807.png
http://stockcharts.com/c-sc/sc?s=$OEX&p=D&yr=1&mn=2&dy=0&i=p12339330426&a=29903483&r=6807.png
#5
thespookyone
-

- Traders-Talk User
- 6,043 posts
Member
Posted 31 December 2008 - 09:27 AM
Swiss-If your count is right, I doubt the B is actually done.
#6
kc135a
-

- Traders-Talk User
- 501 posts
Member
Posted 31 December 2008 - 11:39 AM
We could have the same fractal....
Nice chart. I think the 50% retracement is more likely given history but the basic idea looks great.


