This is one of the most difficult markets to analyze in recent memory. The bulls would have you believe that all is well, that the correction is over, and that nothing stands in the way of a resumed bullish trend for most of the rest of the year. The bears, on the other hand, would have you believe that the market is overly optimistic, that no one has learned the lessons of overvaluation and that this house of cards is about to crumble. The real truth lies somewhere in between, I'm sure, but figuring out where is the hard part.
I do not like to see "V" bottoms on charts. Over the intermediate term, they usually are retested to find that either 1) the "V" bottom is broken and prices go much lower, or 2) the "V" bottom holds thereby forming the more conventional and generally more powerful "W" bottom. The point is, that the market usually goes back down and retests that "V". I find the current situation somewhat similar to 1998. The market had sold off sharply that year in August. But on September 1st, the market bottomed and rocketed upward. It seemed like the worst was over, and bulls were expecting the next leg of the bull market to begin immediately. As it turns out, the Long Term Capital hedge fund crisis was the catalyst for another market decline -- a very sharp and swift one -- which eventually led to a "W" bottom. Then the next leg of the bull market started.
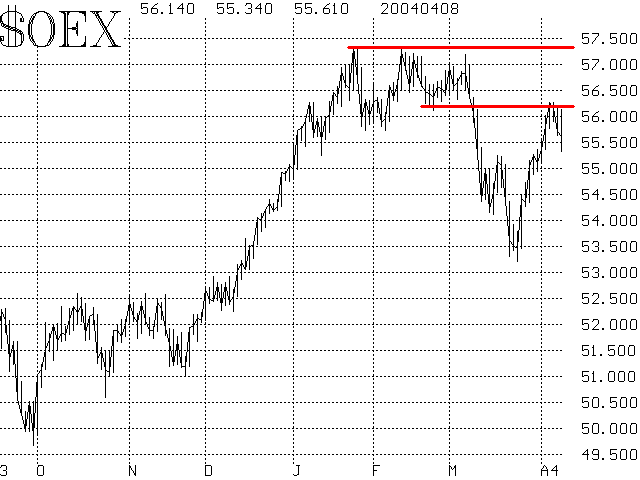
Currently, the rally off the March bottom has brought the major averages right back up to there they were trading in February. $SPX has been stronger than $OEX or the Dow, so it has penetrated further into that February trading range, but even so, all of them face heavy resistance at the former series of tops that were formed from late January through early March, or at even lower levels. Look at the chart of $OEX in Figure 1 where these resistance levels are marked.
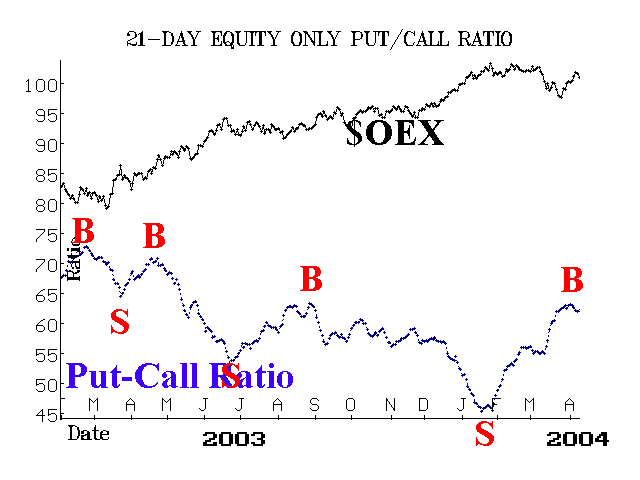
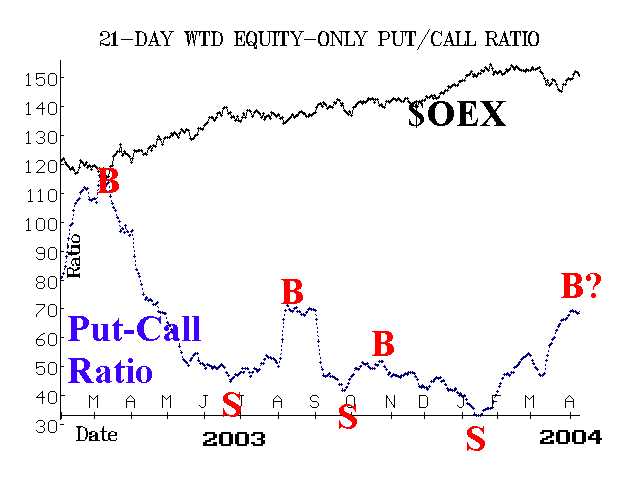
Our other technical indicators are somewhat mixed. Put-call ratios are just now turning bullish. Look at the chart of the standard equity-only put-call ratio, Figure 2. It has just now rolled over to a buy signal. The weighted ratio -- Figure 3 -- appears to be rolling over to a buy as well. However, our computer analyses do not yet identify the weighted chart as being on a buy signal. Hence, the question mark on the chart. You might rightfully ask if these signals have arrived too late to be of any use -- considering that the actual bottom was nearly two weeks ago. I don't think so, since these are intermediate-term signals. Look at Figure 2. If the market were to rally from here in an intermediate-term bullish move, one would not be overly concerned that this buy signal came a little late. It still looks reasonably close to the bottom on the $OEX chart and if a long-lasting upleg develops, it will not be important that the put-call ratio buy signal came a few days late. Other broad market put-call ratios have mostly rolled over to buys: this include the QQQ weighted ratio, the $OEX weighted ratio, and both the standard and weighted S&P 500 futures ratios. We also see a number of put-call ratio buy signals in individual big-cap stocks, such as GE, IBM, Intel, Merck, and Microsoft.
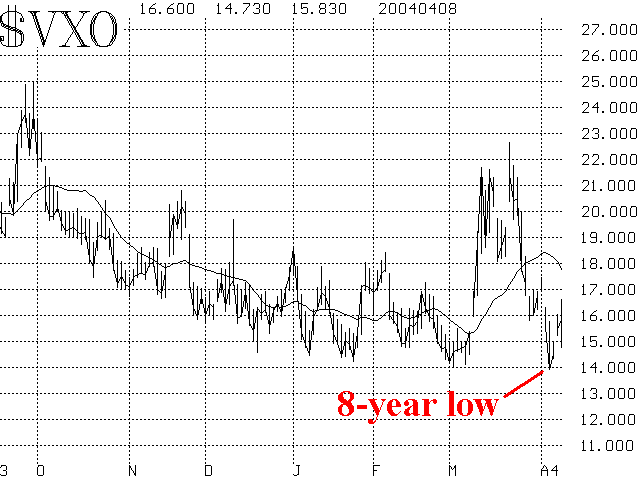
Volatility indices generated buy signals and have since collapsed back to near their lows. In fact, $VXO, made an eight-year low earlier this week. Thus, these indicators are no longer bullish. They are more or less neutral as long as they remain below 18 or so, but another move above that level would be a bearish signal.
Market breadth was very positive during this latest rally. However, it reached overbought proportions and now sell signals are imminent.
The bulls are all excited about the upcoming earnings reporting season, which essentially runs from now through the end of April. Remember, the market discounts news, and so a good portion of the recent rally has already built in positive earnings expectations for this quarter.
In summary, we are viewing the major indices as having more downside potential than upside. We would change our opinion if $SPX closed above 1170, $OEX above 573, and the Dow above 10,750. However, QQQ looks more positive. It overcame one resistance level last week and thus remains bullish unless it closes below 36. Also, note the NYSE vs. NASD put-call chart (top, right, of page 6). It is the NASD portion of the put-call ratio that has pushed the standard equity-only put-call ratio to a buy signal


