
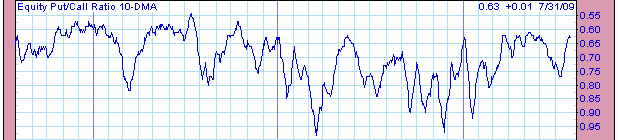
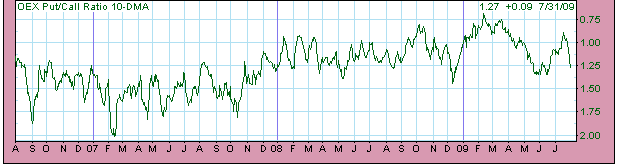
Viewed together the chart of the 10 dma of the equity p/c ratio and the 10 dma of the OEX p/c ratio look like the jaws of shark, open wide and ready to de-limb his adversary.
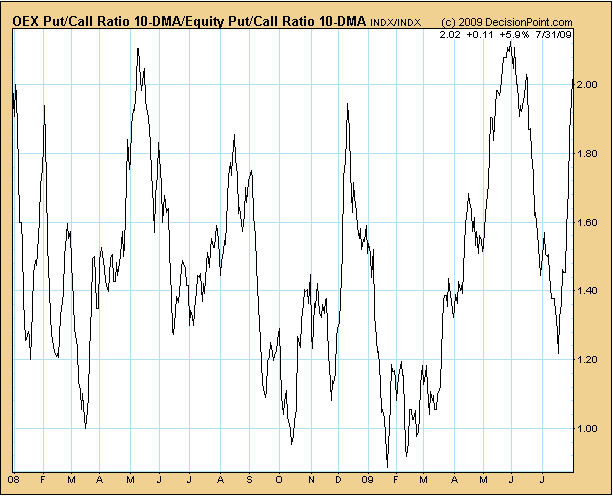
But seriously, if you were to compute the ratio of bottom chart reading to the top chart reading, at 2.0 this is probably the highest ratio since October 2007- the exact peak. That is to say, normally correct OEX option players are buying puts at unusually high levels while normally wrong equity players are buying calls at unusually high levels, either one a sign of trouble, but together.....well we'll just say there's blood in the water.
Just another "flag"....
Sorry the DP charts from 4 weeks ago do not reproduce now in the above post, but you can locate those "jaws" back in early July on the new DP charts above.
The market went sideways a few days then dropped 70 point vs. SPX.
http://stockcharts.com/c-sc/sc?s=$SPX&p=D&st=2009-01-01&en=2010-01-01&i=p55428246897&a=173216392&are=6944.png
Let me emphasize: Short term I see a similar set up here- though perhaps 40-50 SPX points would contain it at this point, imho. The ratio of oex to equity 10 day readings was then 2.0. Today it is 2.016. Just a comment on short term sentiment. IT and LT is a whole 'nother animal, and that post is not ready yet.


 I meant Jun 6, 2009.


