
Sep 5 2009, 11:52 AM

photo credit
Aug 23 2009, 10:39 AM
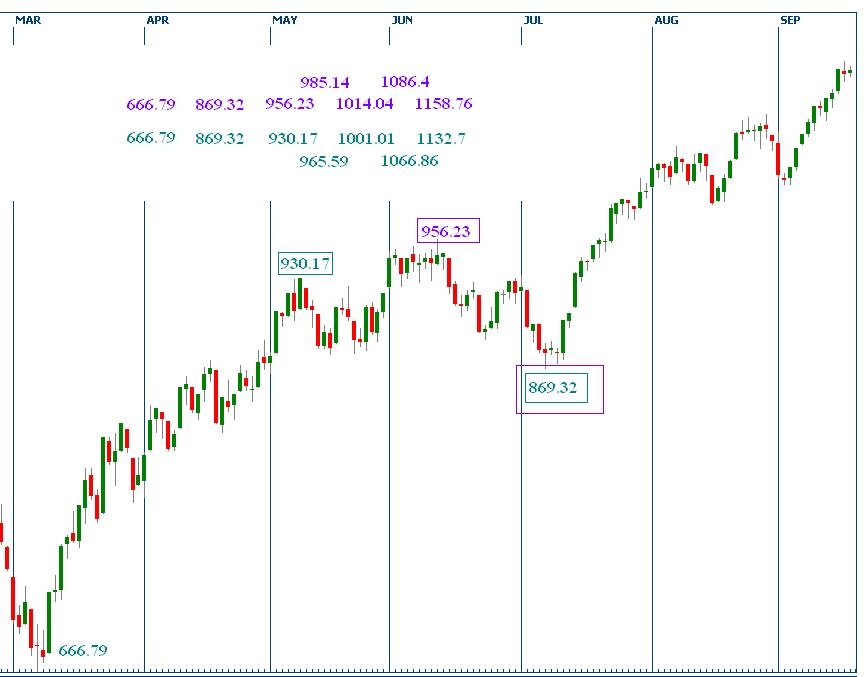
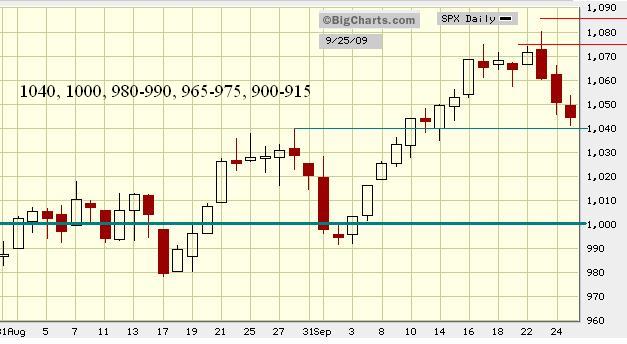
A critical battle may take place in the zone 1034-1065.
As speculated in 05/03's post, bull took out 947, so as 1014. when bull "steps into" 1053-1068, then 1122 is the next target. The 08/16s Chart suggests the resistance zone 1034-1065 will reject Bull's first attempt but the rejection does not warrant the termination of wave B. The counter trend rally will come to an end if it dives below 901-893 or the resistance zone 1034-1065 rejects bull's second attempt (after a sizeable pullback).
08/21
08/16


synopsis:
(1) The counter trend rally consists of 3 waves.
- a. 667-956
- b? 956-869 [? - denotes uncertainty]
- c? 869-1158? (if c equals a)

(2) wave c? has to surmount the major Fibonacci cluster 1014-1054 to reach the target 1158
(3) so far, the wave c? has breached 1039 then retreated. it forms a local frame 869.32-1039.47; The gauge to signify further weakness is a 0.382 retracement at 974.74. From the following chart, the gauge is lower than 978.51 so the importance is obvious.
Now, the question is whether the index can smash 1026 and launch the second attempt on 1034-1065 without any meaningful pullback?

(4) If the hard astro aspects will drag the index down, the effect will be apparent in the next 4 weeks. especially due to the third opposition of the 5 Saturn-Uranus opposition alignments.
(1) 11/04/08
(2) 02/05/09
(3) 09/15/09(Bradley turn date)
(4) 04/26/10
(5) 07/26/10

(5) support zone 893-915, resistance zone 1034-1065.

Entering the High power zone
Aug 1 2009, 10:23 PM
-----------(See note)---------

December 19th, 2008 @ 4:28 am by Astro Transits
Astrological transits Stock market crashes - Thursday, December 18, 2008
Period 1: September-October 2008 (high strength!)
Period 2:
Period 3: around 14 August 2009 to mid September (another high strength!)
Period 4:
Period 5:
Period 6: around 19-26 June 2010 (brutal strength aspect!)
Period 7: mid December 2010 (high strength!)
Period 8: mid August 2011 (the final blow)
period 3 time window
Jul 23 2009, 09:56 PM
08/05
109 trading day cycle, 03/06/09-109-08/05, not a dominant one
08/14
465 trading days from 10/11/07 (Peak 1576) to 08/14/09
09/07
1260 trading days from 10/10/2002 Low to 10/11/2007 High
its 0.382 has 481 trading days, to be due on 09/07/09
09/30
109 trading day cycle, 04/24/09-106-09/24-09/30/09, may become the dominant one
(1) The North Node
schedules - Moons North node leaving Pisces in 2008 and enters Aquarius in entire 2009
1st Jan 2008 00 Pisces 21
1st July 2008 20 Aquarius 42
1st Jan 2009 10 Aquarius 58
1st July 2009 01 Aquarius 23
1st Jan 2010 21 Capricorn 38
The North Node (Dragon's Head) is the zodiacal point the Moon crosses the Ecliptic on its way upward [ascending] (to north); the South Node (Dragon's Tail) is the downward [descending] (to south) cross-point of the Ecliptic.
(2) Pluto will turn direct at 00Capricorn03 on September 12, 2009.
"Once again this is a momentous moment" Link to "A Theory of an Economy - Part Two"

Link to - Current & Upcoming Retrogrades and Stations 2009: Cafe Astrology .com

(3) Saturn opposing Uranus.
In 2008-2010, there are Saturn-Uranus opposition in exact alignments:
(1) 11/04/08
(2) 02/05/09
(3) 09/15/09
(4) 04/26/10
(5) 07/26/10
THE OPPOSITION FROM SATURN TO URANUS, 2008-2010,"The markets came very close to crashing on the first Saturn-Uranus opposition ten months ago. They dropped again noticeably on the second pass in mid-January. In three weeks time, Saturn will once again move to within five degrees of opposing Uranus and be closing in. I do not think it is possible for the markets to break the pattern and withstand the effects."
Link to source
"I still think all mayhem is going to break loose towards the end of August. There will likely be violent uprisings and attacks flaring up around the world. Weak structures of all forms, physical and institutional, are going to once again be tested and collapse. I still think the global markets will crash severely. My only reservation is that it might happen a week or so after August 14, but very likely begin by the time Mercury turns retrograde on September 7, 2009. Let's just watch with interest."
01/11/09 retrograde
01/31/09 direct
05/06/09 retrograde
05/30/09 direct
09/06/09 retrograde
09/29/09 direct
12/26/09 retrograde
01/15/09 direct
Taklamakan Desert sand storm

Taklamakan desert: http://en.wikipedia....wiki/Taklamakan
Tarim Desert Highway http://en.wikipedia...._Desert_Highway
Note:
Astro events can hardly ties with a quantitative number credibly. While those hard aspects may drag down the index, in E-wave view, if index moves down in the next 8 weeks modestly, it is considered as a correction. In as such scenario, the wave structure since March low looks bullish.
I speculate there is a possibility we will see the Up wave bring the index to somewhere around 1122 to 1229. Thereafter, It would be the Primary wave C that bring the index down to a new low.
Jul 25 2009, 07:54 PM
Overall big picture
---- 11/10/07-primary A-1576.09-666.79
---- 03/06/09-primary B-0666.79-???.?? (in progress)
The primary wave B have 3 major waves: a,b,c .
May 10 2009, 10:07 AM

May 3 2009, 08:17 PM
The FIB pivots from the major frame [667:1576] are: 881, (947), 1014, (1068), 1122, a 0.382 retracement is 1014. from the secondary frame [1440:667], a 0.5 retracement is 1053
The wave structure can be realized (but not necessary the only way) as primary wave A [1576:667], and primary wave B [667:?](in progress). The goal is to see the primary B will either reach 1014 or 1122. The gauges are 947 and 1053-1068.
Apr 29 2009, 03:23 PM
881.38 = [0.236|666.79:1576.09] and 877= [0.618|1007:667]
The points between 877 [middle spring target] and 881 is small but by surmounting 881, the wave hierarchy changes. The rally wave since March 6th becomes a major wave. Therefore, a primary wave B (Up, counter-trend) has commenced. It is at the same level as the wave from Oct/07 to March/09 (Primary A, Down).
Apr 17 2009, 02:32 PM
SPX intraday high 875.63
The middle Spring target has been met. By hitting 875.63 demonstrates the March low 667 might be a well established middle term Trough.
Mar 20 2009, 12:13 PM
Last update 03/14
We got the counter trend rally early confirmation
Last update 03/08
The overall picture is to expect the counter trend rally in March/April. The softness in March (3/11-3/19) due to the 109 trading cycle is expectable; Soon We will find out that particular cycle's low will recur again or it has already behind us.
Judging from the low we have seen, the counter trend rally might just retrace up to 838.01 [0.618|943.85:666.79] or 877 [0.618|1007:667] in the Middle Spring. The early confirmation for such possibility is to see index climbing above 716.6 [0.236]
Root 01/23/2008 [3 more cycles prior to 01/23/2008]
11/21/08-106-04/24/09
04/24/09-106-09/24-09/30/09
Root 10/10/2008
10/10/08-106-03/11-03/19/09
03/11/09-106-08/12-08/21/09 (08/14)


