Jump to content


Photo

SPX monthly outlook - October, 09


  • Please log in to reply
21 replies to this topic

#1 stanley

stanley

    Member

  • Traders-Talk User
  • 167 posts

Posted 27 September 2009 - 06:49 PM

SPX monthly outlook The Hunt for Red October
09/27/2009 - Stanley

Last month Vivid September

Recap:

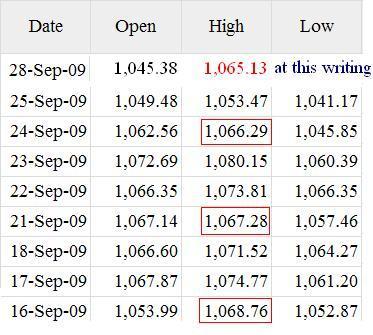
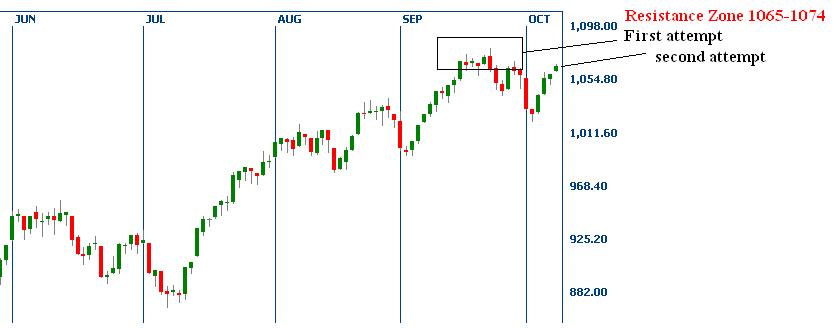
Sep 26, 11:29 AM - I consider 1080 was an aberration when index attempted breaking the half power zone 1070-1074. Without sizeable pullback, even though index made a seemingly failed attempt on the upper zone. The chance to greet 1122 still cannot be ruled out.

[url="http://<a%20href="http://scienceworld.wolfram.com/astronomy/AutumnalEquinox.html"%20target="_blank">http://scienceworld....quinox.html</a>"]Autumnal Equinox[/url]: a Day to Fall For Autumn Begins, Date 09-22-2009, UT 21:28

Profound autumnal colors:

[Five-color mountains, China] http://z.abang.com/d.../-/-/yc0002.jpg
[Kunlun Mountains, China] http://static.panora...nal/6594166.jpg

Summary outlook for October:

In a succinct way, the September movements did not produce any surprises. the trend was neither regressive nor inceptive. Therefore, the ambiguity extends into October; I speculate index may have a milder lower bound attempt and there may be another attempt on the higher bound. The outcome from these attempts set the middle term tone. A decisive breakdown in the lower bound leads to the long awaited red October.
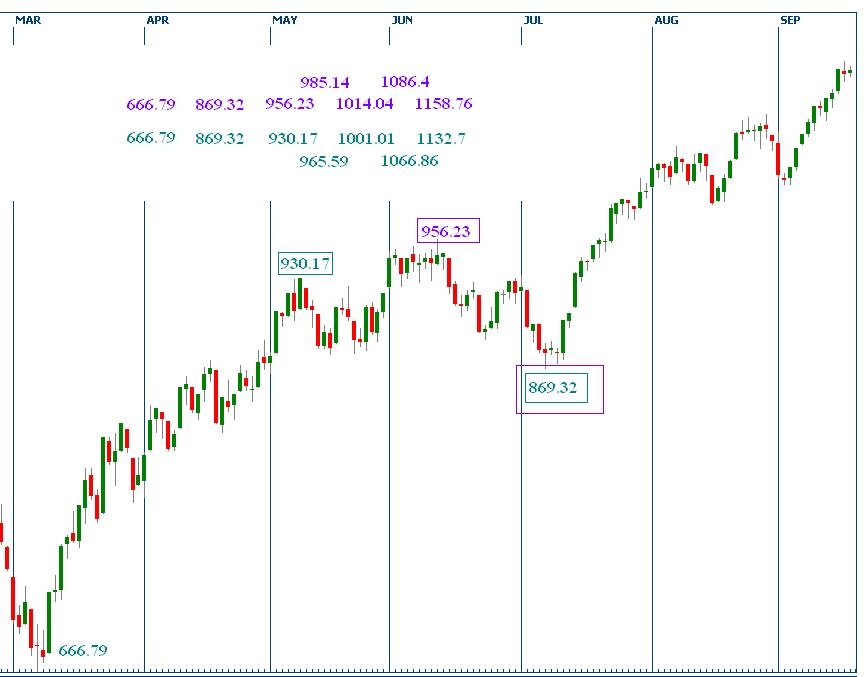
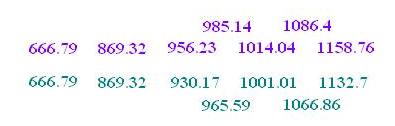
Fibonacci:

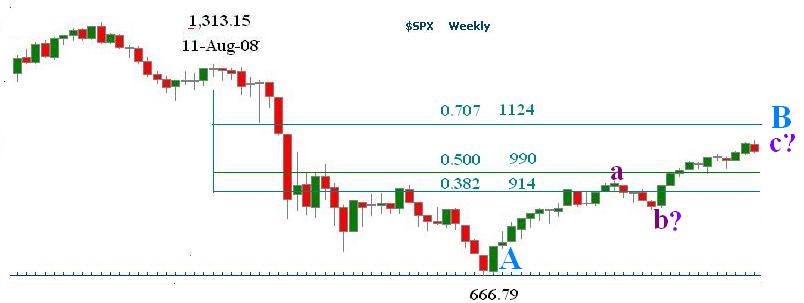
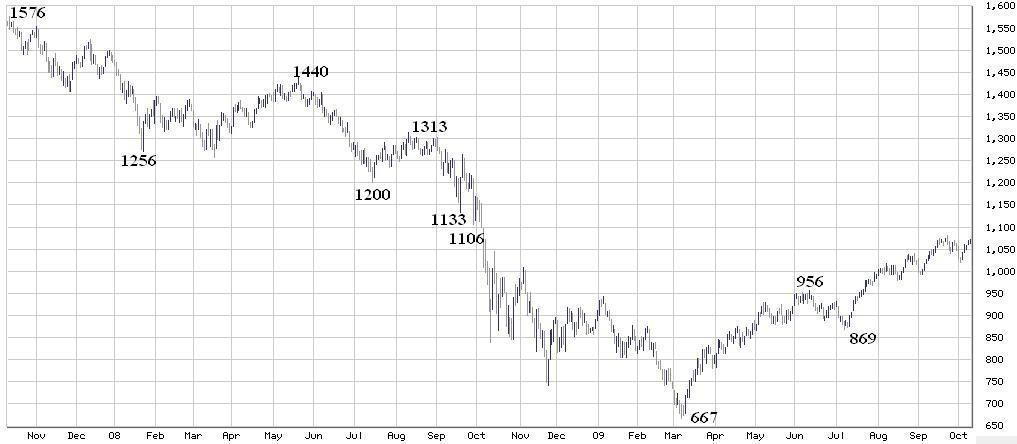
For near term, the support remains in 1040-1045, resistant 1065-1074; The early sign for a reversal is to see index dive below 1000-1014. further confirmation is to see index dive below 950-975, better confirmation is to see index drop below 900-915. The more time the index flirts with these confirmation levels, the more the underlying economy will decay. But, ironically, the higher the possibility to see a rampant overshoot that jumps over 1100 mark. Resistance zone are 1065-1074, 1086-1090. This chart (09/19) indicates a few key support/resistance clusters. Coincidently, the middle point between 1086 & 1158 is 1122.

May 10, 10:07 AM
Posted Image

Sometimes, a lesser suspected point becomes retracement reference pivotal point. Here is an example:
Sep 26, 9:29 PM
09262009.JPG

The steep slope follows the right "head" implies some consolidation period.
Apr 19 2009, 07:54 PM
Posted Image

Astro:

The Saturn-Uranus opposition – 5 alignments in 2008-2010.

(1) 11/04/08 (11/21/08, lagging, low 741.02)
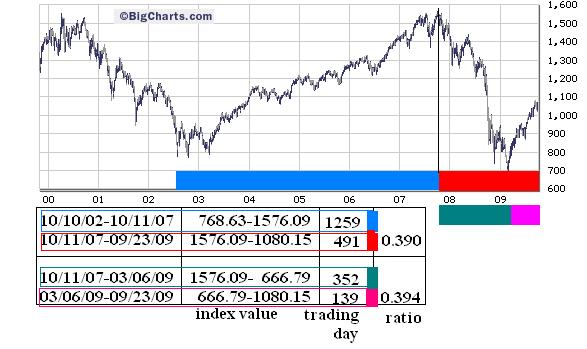
(2) 02/05/09 (03/06/09, lagging, low 666.79)
(3) 09/15/09 (impetus to be observed)
(4) 04/26/10
(5) 07/26/10

Posted Image

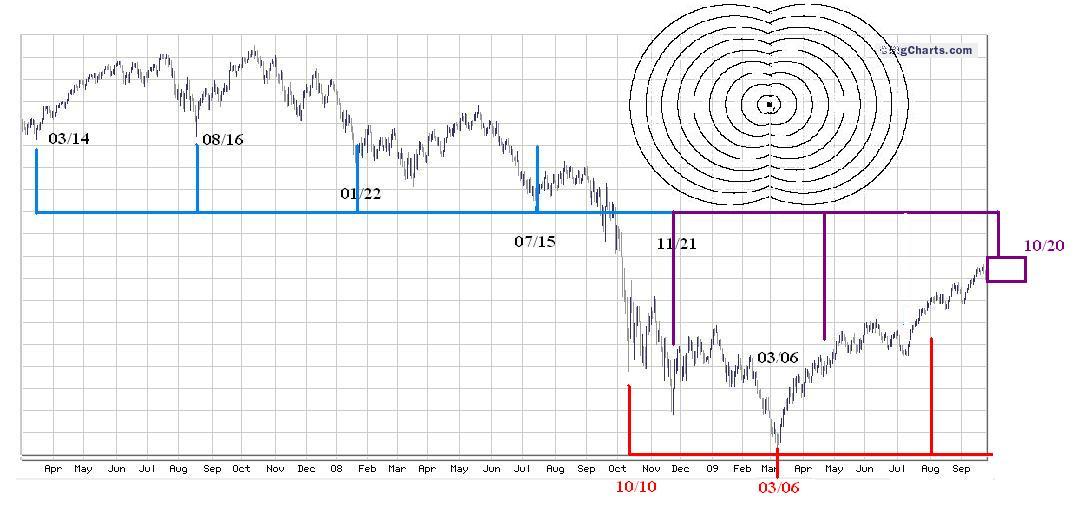
The 109 trading day cycle:

There are two 109 trading day cycles interleaves each other. So far, there is no comfortable assessment can be made. Which cycle caused the low on 11/21/08 is hard to reconcile. Perhpas, the ambiguity is due to the folding of the harmonics. In my entertainment work, I applied 109 trading day cycle. In technical term, these cycles (30, 54, 74,109) are harmonics. In the resonant conditions, a particular resonant frequency ( inverse of cycle ) can persist. In the non-linear stock market, I guess the resonant oscillation may repeat only a few cycles, then, it will either dampen out or merge with other harmonics. Once the overall market provides the same rhythms conditions, the resonant harmonics recurs.

Dec 6 2008, 05:02 PM
Posted Image

The cycle with root on 10/10/08 “supposed” to be a secondary event in late March, but, it became dominant and marked the March’s low. Its cycle length is 4-6 days shorter than the “nominal” length.

10/10/08-100-03/06-100 (significant)
03/06/09-106-08/06-106 (insignificant)

Conversely, the cycle with root on 11/21 “supposed” to be a dominant cycle, it became insignificant in April. If there is an “alternation” action between this two cycles, the time window to be observed can reach October 20. If the low recurs, it is probably a secondary event.

11/21/08-106-04/28/09 (insignificant)
04/28/09-106-09/28-09, 110-10/02/09,120-10/20/09 (could be a secondary event)

cycle01.JPG

#2 stanley

stanley

    Member

  • Traders-Talk User
  • 167 posts

Posted 28 September 2009 - 02:53 PM

intraday frame:
1065.55= [0.618||1080.15 ::1041.17]
0928.JPG

The following chart has two sets FIB series. It meant two sets of waves could be assigned. The intent is to speculate which route is actually favored by the Market.

1066.86 = [0.500|| 1001.1::1132.7]
Sep 20 2009, 11:35 PM
Posted Image

1066.24 = [0.618||1313.15::666.79]
Sep 27, 04:49 PM
Posted Image

#3 SilentOne

SilentOne

    Member

  • Traders-Talk User
  • 3,452 posts

Posted 28 September 2009 - 04:04 PM

hi Stanley,

A little Gann?

Connect the major highs or lows from 2007 and 2008 to forward dates. Use 360 Calendar days (good to +/- 5 days IMO).

Examples:

3/14/2007 - 3/17/2008 (low to low)

1/22/2008 - 1/21/2009 (low to low or high)

3/17/2008 - 3/06/2009 (low to low)

7/15/2009 - 7/08/2009 (low to low)

Next dates? There are a few of them.

10/10/2008 - 9/10/2009 (+/-) - (low to high?)

Oh and let's not forget the all-time high 11/10/2007.

10/28/2008

11/04/2008

11/21/2008

and so on.

Hurst 40 week low dead ahead. Price should revisit the 20 month MA minimum.

Posted Image

cheers,

john

Edited by SilentOne, 28 September 2009 - 04:11 PM.

"By the Law of Periodical Repetition, everything which has happened once must happen again and again and again-and not capriciously, but at regular periods, and each thing in its own period, not another's, and each obeying its own law ..." - Mark Twain

#4 stanley

stanley

    Member

  • Traders-Talk User
  • 167 posts

Posted 01 October 2009 - 12:30 PM

10/01 intraday low 1,033.57 at this writing (10:19am Paciffic time)

Resistance 1065-1074 has been tested, near term support 1040-1045 smashed.
By breaking the support 1033.94 decisively, it opens the door to see 1000-1014.
(1066.86+1001.01)/2=1033.94

Sep 27 2009, 04:49 PM
"For near term, the support remains in 1040-1045, resistance 1065-1074; The early sign for a reversal is to see index dive below 1000-1014."

Table from the following chart
t1.JPG
http://traders-talk....-1253513102.jpg

#5 stanley

stanley

    Member

  • Traders-Talk User
  • 167 posts

Posted 05 October 2009 - 03:20 PM

Index did not hit zone 1000-1014 in regular session.
Bear’s attempt to reclaiming the 1040-1045 has been rejected at this run.
Now, earning announcement window opens......

Info in (2) seems compatible with the view I posted in (1), to be elaborated.

-------------------------
Sep 20 2009, 11:35 PM
(1) The early sign for a reversal is to see index dive below 1000-1014. further confirmation is to see index dive below 950-975, better confirmation is to see index drop below 900-915.

Aug 16 2009, 12:15 PM link
http://indexcalls.co...89705_thumb.jpg

-------------------------
(2) Four Scenarios for the Fourth Quarter
full texts & charts: http://www.minyanvil...dex/a/24708/p/2
Kevin Depew Sep 30, 2009 12:00 am

Scenario 1
Q4 2009 = Close below 960.84, but above 903.25, so the buy setup is interrupted, but the TDST is potentially qualified.
Q1 2010 = No lower open, no lower low, thus failure to QUALIFY TDST Down level, which means the market lows have already very likely been seen.

Scenario 2
Q4 2009 = Close above 960.84, so buy setup is interrupted, which means again it's likely that the ultimate low is in and 960.84 is the floor

Scenario 3, Scenario 4 ....... use the link to read full texts and charts

#6 stanley

stanley

    Member

  • Traders-Talk User
  • 167 posts

Posted 08 October 2009 - 09:40 AM

from post #1
-----------------------------------------------
I speculate index may have a milder lower bound attempt and there may be another attempt on the higher bound. The outcome from these attempts set the middle term tone. A decisive breakdown in the lower bound leads to the long awaited red October
Resistance zone are 1065-1074, 1086-1090
The early sign for a reversal is to see index dive below 1000-1014.
109 trading day cycle:
04/28/09-106-09/28-09, 110-10/02/09,120-10/20/09 (could be a secondary event)
-----------------------------------------------


Index pulled back mildly. on 10/02 index breached 1019.95, it is 5 points higher than the early reversal confirmation zone 1000-1014.

As indicted in the 05/02's chart, 1019-1020 is a secondary FIB point.
The window of the 109 trading day cycle can reach 10/20.
In wave perspective, the bearish case would be a wave c truncation taking place in the resistance zone 1065-1704. So the outcome of the second attempts on this zone becomes critical.

(05/02) minor FIB point 1019/1020:
http://indexcalls.co...75170_thumb.jpg

wave c can be visualized in this chart:
http://traders-talk....-1254093733.jpg

spx10072009.JPG

#7 stanley

stanley

    Member

  • Traders-Talk User
  • 167 posts

Posted 09 October 2009 - 09:58 AM

Fibonacci Time Zones

Conclusion: We may anticipate an important inflection date in between 09/23 – 11/03. (+/-?)

In this post (Jul 23 2009, 09:48 PM), I mentioned a ratio similar to Fibonacci Time Zones: “There are 1260 (1259) trading days from 10/10/2002 Low to 10/11/2007 High. its 0.382 has 481 trading days, to be due on 09/07/09

Rehash:
From the following chart, I outlined two ratios. 0.390 and 0.394

09/23/09 SPX marked an intraday high 1080.15

The difference between 0.382 and 0.404 is 0.022. This small delta can translate into 1259 * 0.022= 28 trading days, and 352 * 0.022 = 8 trading days [1259 and 353: refer to the chart]

Assume index may deploy an important inflection point between time ratio 0.382 and 0.404. Then the corresponding inflection date is within 8 -28 trading day counting from 09/23/09, thus 10/06 and 11/03 respectively. The time span is relative large (1259,352) so the exact dates may drifts +/-?.


Note:

Ratios:
sqrt(0.618) = 0.786
sqrt(0.5) = 0.707
sqrt(3)/3 = 0.577
0.382+0.404 = 0.786
0.404/0.707 = 0.571

For further stduy, re-align the pivotal date (09/23) if necessary.
Each year has 251 trading days (approximately).

spx_fib_ratio.JPG

#8 stanley

stanley

    Member

  • Traders-Talk User
  • 167 posts

Posted 09 October 2009 - 02:27 PM

I made mistake in the calculations (refer to prior post)
Use 09/23 as reference day, Let's find out how many trading days the ratio will reach 0.404.
(0.404-0.390) * 1259 = 17 or 18 trading days
(0.404-0.394) * 352 = 3 or 4 trading days
To reach ratio 0.404, the time window can reach 10/28; the net overall window is from 09/07-10/28.
The 09/23's peak (1080.15) might be the apex; The confirmation window is getting narrower.

#9 stanley

stanley

    Member

  • Traders-Talk User
  • 167 posts

Posted 11 October 2009 - 12:02 AM

Retracement using Saturn Ring ratios – Stanley 10/11/2009

reference: http://en.wikipedia.org/wiki/Saturn's_rings

Lord of ring - "The rings of Saturn are the most extensive planetary ring system of any planet in the Solar System."
I did a very interesting study. The ratios among those Saturn ring carries are closely tied with popular Fibonacci ratio. Here is a quick summary:

conclusion: S&P500 index 1100 is a major number, ranges 1083-1132

http://upload.wikime...umb/c/cf/Saturn
Source Cassini-Huygens/NASA - http://photojournal....Number=PIA06536
Copyright information from http://www.jpl.nasa....olicy/index.cfm - Unless otherwise noted, images and video on JPL public web sites may be used for any purpose without prior permission

Center distance from Saturn
A ring 129473 (122,170–136,775)
B ring 104790 (92,000–117,580)
C ring 83329 (74,658–92,000)

Ratios:
C/B 0.7951999
C/A 0.6436014 (1/0.786)/2=0.636
B/A 0.8093579 (1-0.382/2)=0.809=(1/1.236)
1/0.8093579=1.236
0.8093579/2=0.405 (0.786-0.382=0.404)
(0.7951999+0.6436014)/2=0.7194007

Retracements
[0.6436014||1313:667]=1083
[0.7194007||1313:667]=1132
(1132+1083)/2=1108
[0.8093579||1200:667]=1098
[0.6436014}}1440:667]=1164

Extensions
(956-667) * 0.8093579 + 869 = 1103
(956-667) * 0.7951999 + 869 = 1099

Discussions:
try to enumerate some other ratios [ table in http://en.wikipedia.org/wiki/Saturn's_rings ]

For comparison purpose:

“standard” wave FIB extensions
first leg 1576-1256, length 320
320*1.382+667=1109
320*1.236+667=1063
(1109+1063)/2=1086

“standard” FIB retracements
[0.809||1200:667]=1098
[0.500||1576:667]=1122
[0.707||1313:667]=1124
[0.618||1440:667]=1144

10112009spx.JPG

#10 stanley

stanley

    Member

  • Traders-Talk User
  • 167 posts

Posted 14 October 2009 - 02:56 PM

from post #1
04/28/09-106-09/28-09, 110-10/02/09,120-10/20/09 (could be a secondary event)
Resistance zone are 1065-1074, 1086-1090


recap: On 10/02 index breached 1019.95, even though the 109 trading days cycle time window can reach 10/20. as speculated, this cycle is only a secondary event.

from post #8
To reach ratio 0.404, the time window can reach 10/28; the net overall window is from 09/07-10/28.
from post #9
conclusion: S&P500 index 1100 is a major number, ranges 1083-1132
from Post #1 in http://www.traders-t...?...st&p=481638
I speculate there is a possibility we will see the Up wave bring the index to somewhere around 1122 to 1229.

recap: The overall wave looks bullish, the best outcome for bears is a consolidation process. Crash is a rare event.
A very preliminary view for the next few months: If the pullback is not lower than 1034-1066, index might challenge 1158, and then 1229. There is some tough work for both bulls/bears in the range 1083-1132. The lower range support is 1000-1014 and 960.


Bulls win a major battle, they smashes both 1074 and 1090