hi Stanley,
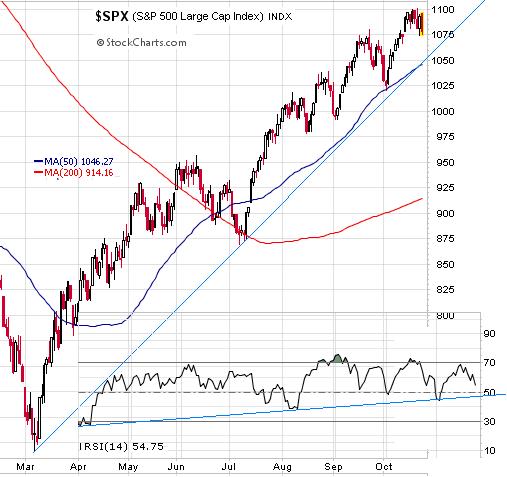
I saw these Bradley charts the other day. The source is Amanita's annual forecast (2009). I'm not an astrologer, but what do you see in these charts? Next year figures something big. What is out there that will cause the biggest signatures since the 1930s and 1870s? That last Saturn-Uranus opposition is in play I would imagine. We just had one in Sept., the third of five in this series. The next one arrives in July next year as you have shown. The next 18 month Hurst cycle low comes in about August 2010. It shows an interesting alignment with my Hurst cycle stuff.
Have a nice weekend.
cheers,
john
http://traders-talk....-1256346700.png
http://traders-talk....-1256346733.png
Hello John
Me too, I am neither an astrologer nor an astrology narrator, When comes to speculation, I bear neutral stance on these astro events. From what I have read, there are negative planetary aspects in 2010, June 5/6, July 30/31, August 6/7. December 13
Link, in particular, the Grand Cross on August 6/7.
Part (I) The Quest for PI based multiples
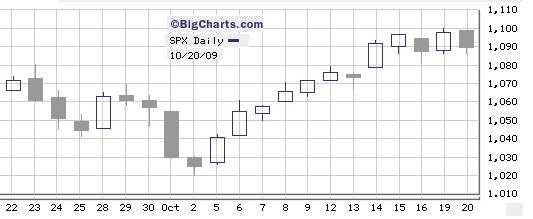
US Stock Market
"monumental" dates:
* Black Monday, October 19, 1987
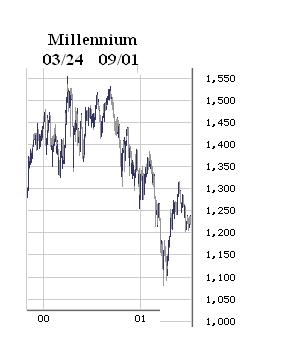
* Millennium Internet peak (SPX), March 24, 2000
* First 4 year cycle low since millennium, October 10, 2002
* The apex of Great Reflation, October 11, 2007
* The first Trough since the Great Reflation, March 6, 2009
The trading days in between these
monumental dates can be obtained by downloading the Yahoo historical into a spreadsheet [
http://finance.yahoo...om/q/hp?s=^GSPC ]
By converting the trading days into PI based multiples, a set of whopping numbers pop off!
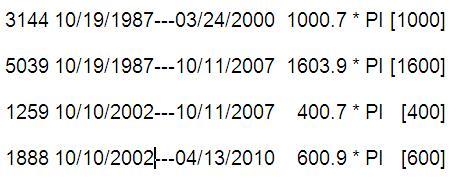
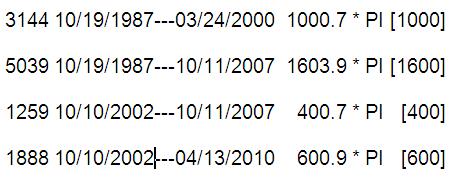
For example, there are 3144 trading days from Black Monday to millennium Internet peak (SPX), equals 1000 * PI [ 3.14159265... ]
These PI based multiples are within the numerical margin of the following Fibonacci numbers
1 2 3 5 13 21 34 55 89 144 233 377
610 987 1597 2584 4181 6765 .......
There are 1259 trading days (400 * PI) from 4 year cycle low date (10/10/2002) to the Apex of Great Reflation date (10/11/2007). Half of 1259 is 629, adds it to 1259 equals 1888, equals 600 * PI
629 trading days (200 * PI) from the Apex of Great Reflation date (10/11/07) maps to April 13, 2010 ( I may miss a few days due to holidays)
There are 112 trading days from the Millennium Internet peak (SPX 03/24/2000) to the reaction high in September 1, 2000, From that day, market headed to the 4 year cycle low, October 10, 2002. 112 is in the range of the 109 trading day cycle. So, adds 109/100 trading days to
April 13, 2010, it maps to
September 17, 2010

Discussions:
Long PI based multiples seems having some magic. When comes to astro expenditures, as mentioned by Richard Nolle: dont expect an event will occur on the exact Astro aspect date.
( a ) The Saturn-Uranus opposition 5 alignments in 2008-2010.
(1) 11/04/08 (11/21/08, lagging, low 741.02)
(2) 02/05/09 (03/06/09, lagging, low 666.79)
(3) 09/15/09 (insignificant @ at this writing)
(4) 04/26/10
(5) 07/26/10
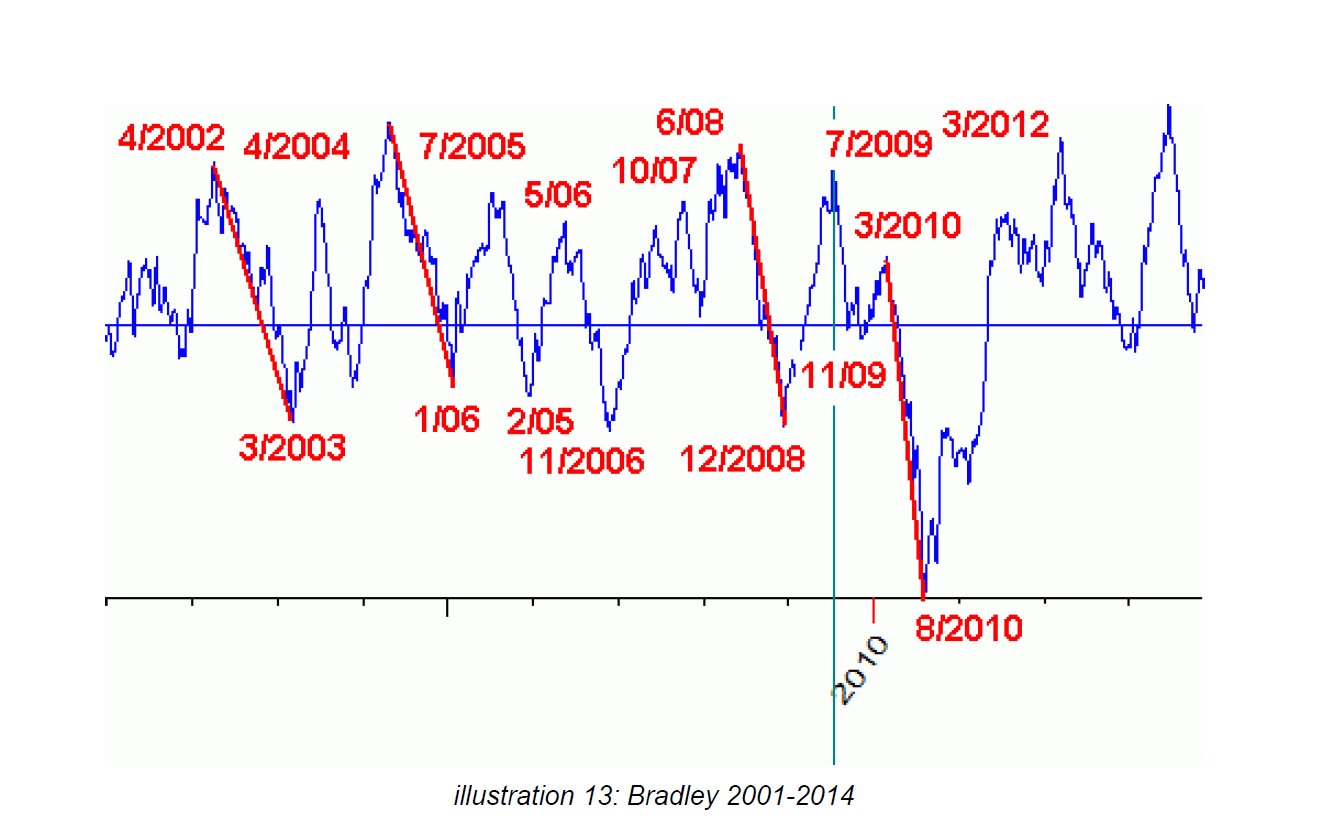
( b ) Bradley turn dates - Important: 03/01/10, 08/10/10, secondary 09/11/10, 09/30/10.
Question: What is out there that will cause the biggest signatures since the 1930s and 1870s?
Part (II) The Grand Cross and An Alignment for Our Times
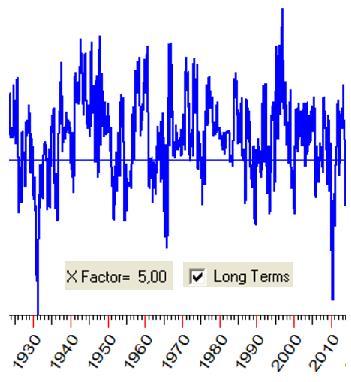
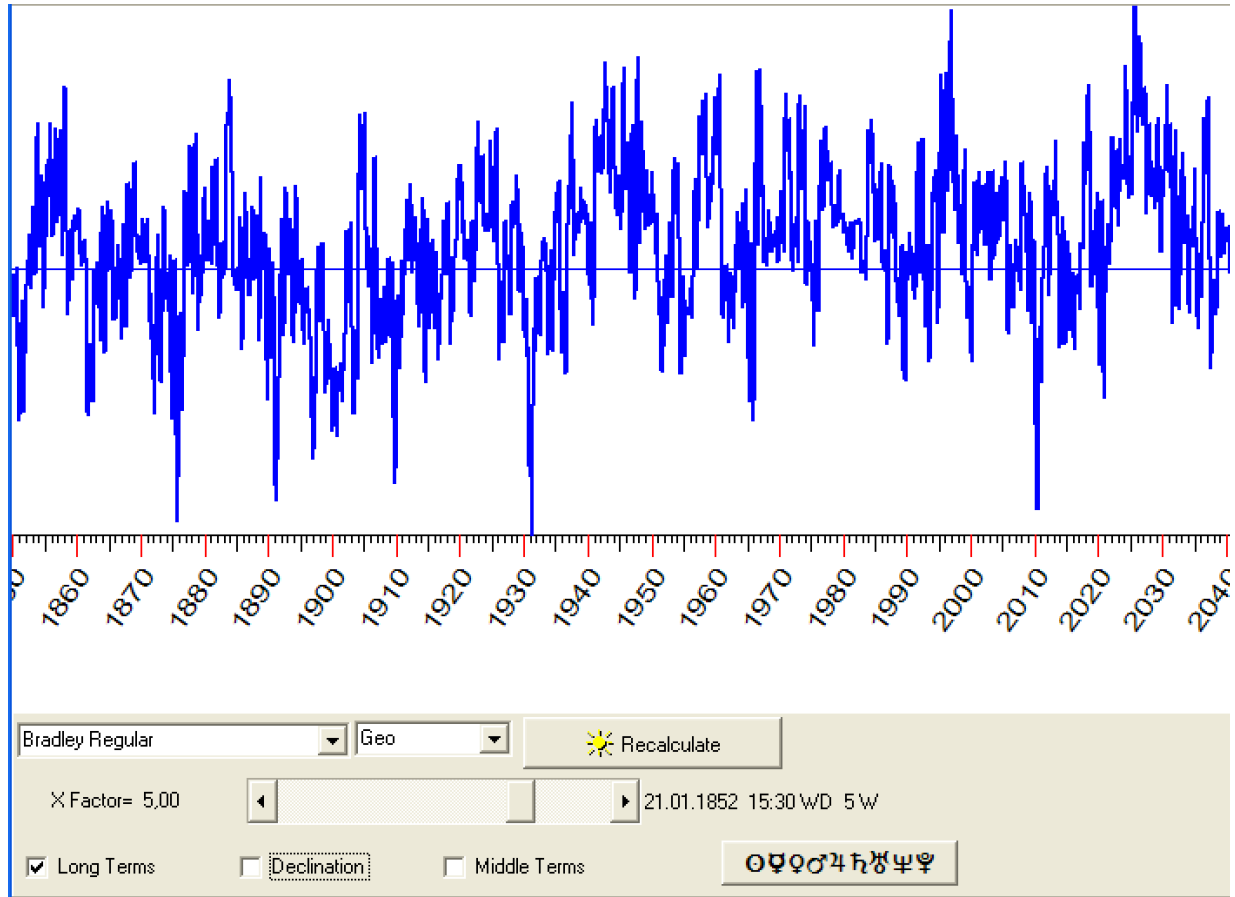
The particular setting (
Declination off, Medium terms Off. Long term On, W=5) applied by the above chart may focus on extracting and highlighting the long-term planets effect. (see info Insert)
Info Insert:
Constructing The Siderograph -
http://gamma.dhs.org...es/bradley.html
S = W ( L + D ) + M
Where: M is the sum of the (m)edium terms, L is the sum of the (l)ong terms, D is the average of the sum of the (d)eclinations, and W is a factor used to add extra (w)eight to the long-term planets (Bradley suggests W=4).
The Grand Cross
on August 6 of seven planets as Venus joins the alignment, and the Moon moves into Cancer
quoted info: - source
http://en.wikipedia....oss_(astrology)
In astrology, a grand cross is said to occur when four planets are all separated from each other by square aspects (90 degrees apart). A grand cross can also be viewed as two oppositions (180 degrees apart) separated from each other by a square. In a grand cross, there is one planet in each astrological element (fire, earth, air and water) but all the planets are in signs of the same modality or quality.
This aspect resembles another grand cross that occurred during the 1930s
One particular example of a cardinal grand cross will occur in summer 2010 when Pluto, Uranus and Jupiter and Saturn and Mars will be at 0-3º Capricorn, Aries and Libra, respectively, while inner planets transit at 0-3º Cancer.
quoted info source
http://www.hermes3.net/2010.htm
The Crosses of Summer, 2010 There are two powerfully transformative planetary alignments in the summer of 2010. A T-Cross on July 30, in the fiery dog days, of six planets -- the Moon, Mars, Jupiter, Saturn, Uranus and Pluto -- all forming a very "difficult" and "stressful" set of 90° squares and 180° oppositions in the cardinal signs of Aries, Libra and Capricorn. A Grand Cross on August 6 of seven planets as Venus joins the alignment, and the Moon moves into Cancer
The Grand Cross chart:
http://www.hermes3.n...ndCross2010.jpg
(To respect the Copy Right, hot link disbaled)
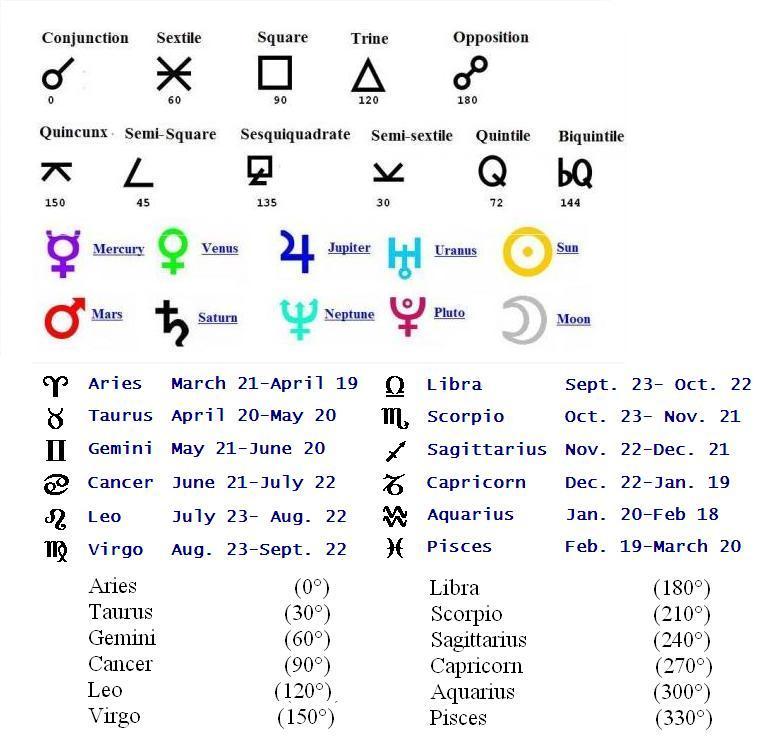
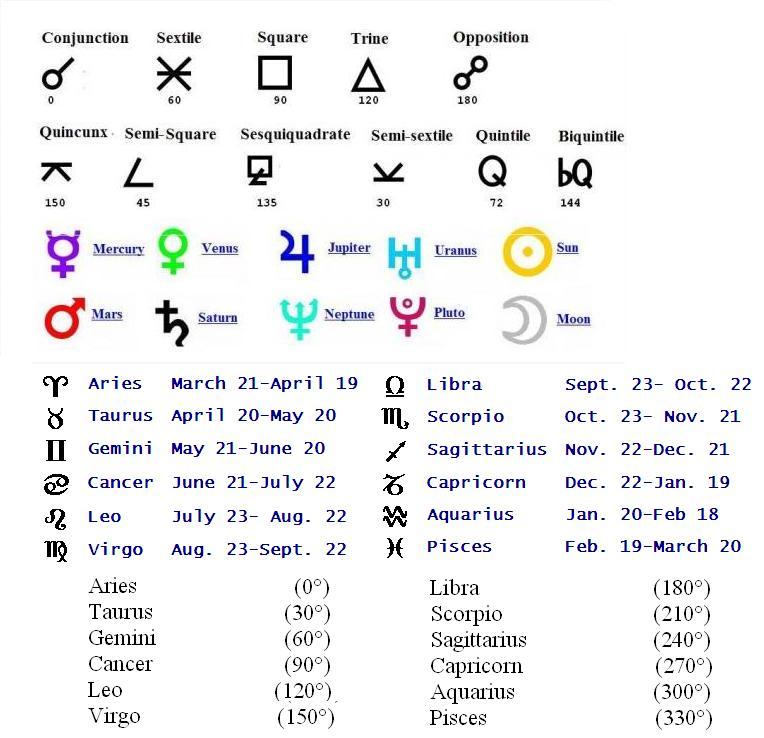
To aid reading the above chart, I have complied an astro symbol chart
Lunar node:

quoted info: source
http://www.users.glo...wood/agenda.htm
August 6-7, 2010: A cardinal grand cross is formed, involving Jupiter-Uranus in Aries, Pluto in Capricorn, the Moon in early Cancer, and Venus joining Mars and Saturn in early Libra. The Sun at 15° Leo makes stressful aspects (45°/135°) to the entire grand cross.
An Alignment for Our Times:
The Saturn, Pluto, Uranus Alignment of 2010
by Bill Streett 1/13/04
http://www.astrology...0alignment.html
Discussions:
I think, in retrospect, if double dip or a renewed slump does transpire in 2010, it certainly correlates with the negative astro aspects.
Feldstein Sees Renewed U.S. Slump After Improvement
http://www.fundmaste...recovery-ahead/
Feldstein suggested the economy will contract into next year, and that the pattern of economic turnaround will be more of a seesaw than what he called a beautiful symmetrical W.
All quoted infos: abide Fair use,
http://en.wikipedia.org/wiki/Fair_use


