
Rhapsody of November
November is the 11th month of the year in the Gregorian Calendar
Colorful vicissitudes
http://farm4.static....f417d9583_o.jpg
http://farm3.static....17e17f84b_o.jpg
November Outlook in essence
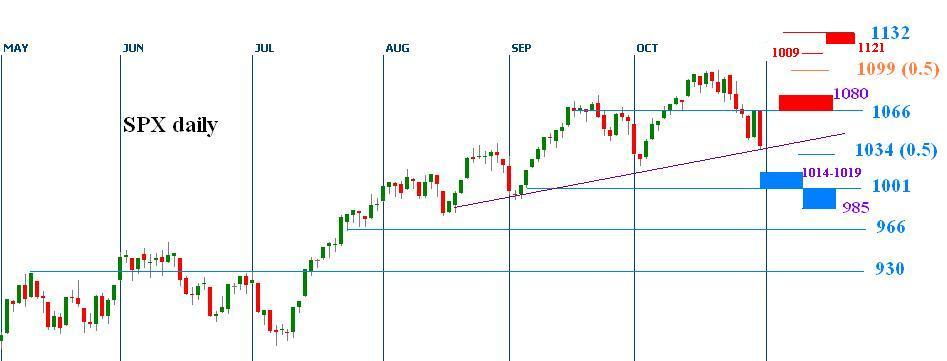
Wait for downside reversal confirmation, an early gauge is to see index dive below 1000-1014; Since index breached 1101 on 11/21, the assault on upper limit 1132, 1158 still cant be ruled out. Upper side breakout gauge is 1109.
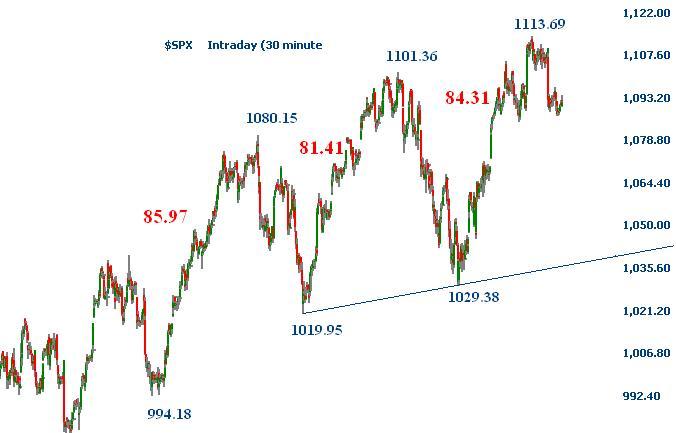
October Recap:
The expected secondary event marked a monthly low (1,019.95) on 10/02. The low synchronized with the 109 trading day low. Then, index gapped over the 1074 hurdle on 10/14, and marked the monthly high (1,101.36) on 10/21. The month end pullback might correlate with the third Opposition alignment between Saturn and Uranus opposition (5 alignments in 2008-2010).
---------------------------------------------------------------------------------
Sep 27 2009, 03:49 PM link
I speculate index may have a milder lower bound attempt and there may be another attempt on the higher bound. The outcome from these attempts set the middle term tone.
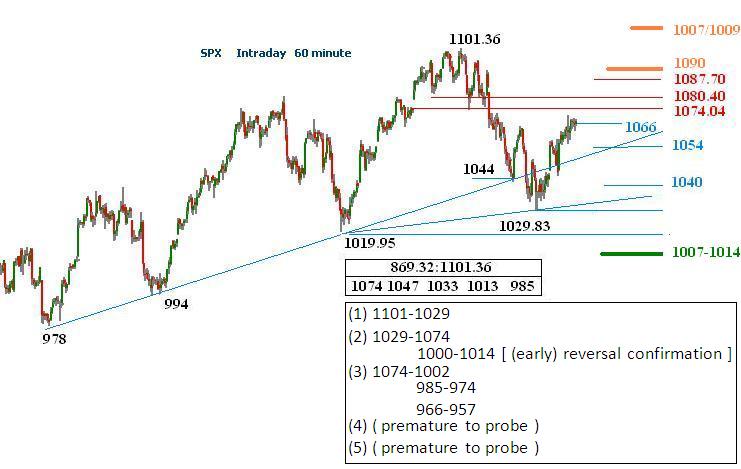
For near term, the support remains in 1040-1045, resistant 1065-1074; The early sign for a reversal is to see index dive below 1000-1014. further confirmation is to see index dive below 950-975, better confirmation is to see index drop below 900-915. ... Resistance zone are 1065-1074, 1086-1090
Oct 14 2009, 11:56 AM link
The overall wave looks bullish, the best outcome for bears is a consolidation process. Crash is a rare event. A very preliminary view for the next few months: If the pullback is not lower than 1034-1066, index might challenge 1158, and then 1229.
----------------------------------------------------------------------------------
when comes to speculation, certain vagueness is to be desired. Let me start with an interesting event: The Leonids meteor shower.
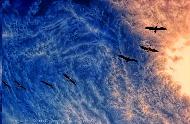
The Leonids meteor shower
reaches its peak around November 17. [ http://en.wikipedia....d_meteor_shower ]
The (uploaded) photograph below is a composite of 30 1-minute exposures taken with a fisheye lens during the Leonid meteor shower in November 2002 from Cape Creus, Spain. Over 70 Leonid meteors are visible here, many of them head on, which makes them look like theyre coming right at the viewer.
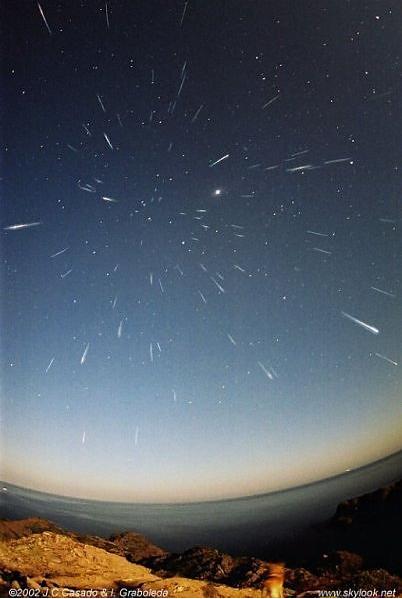
photo credit http://www.environme...e-showers/14319
http://www.nasaimage...onids-and-Leica
Image: Juan Carlos Casado and Isabel Graboleda courtesy of nasaimages.org
in public domain - http://inlinethumb23...S600x600Q85.jpg
The total run of the Leonid meteor shower is from about Nov. 14-20. ([url="http://<a%20href="http://en.wikipedia.org/wiki/Leonid_meteor_shower"%20target="_blank">http://en.wikipedia....teor_shower</a>"](Nov 10-21 wikipedia)[/url]
http://www.space.com...nce_021112.html
"On Nov. 17, 2009, we expect the Leonids to produce upwards of 500 meteors per hour," says Bill Cooke of the NASA Marshall Space Flight Center. "That's a very strong display."
http://science.nasa....leonids2009.htm
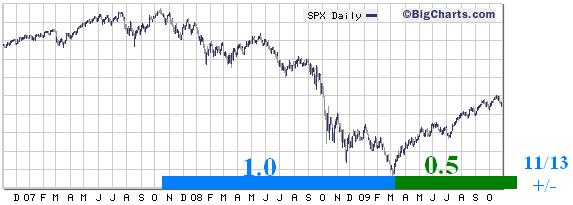
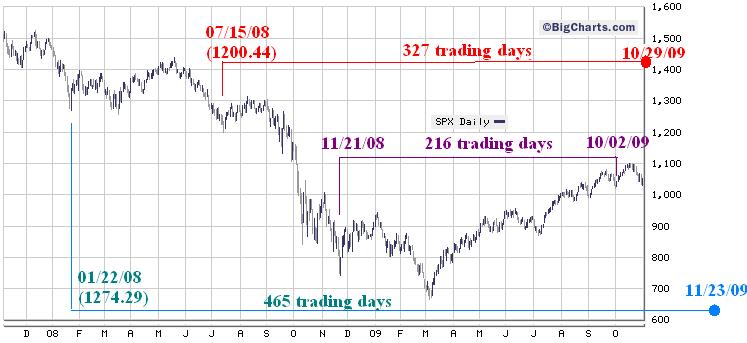
Fibonacci - Time Zone
(prior reference)
The time ratio (Green/Blue) reaches 0.5 on 11/13 with +/- days.
Fibonacci Retracements & Wave
May 10, 10:07 AM

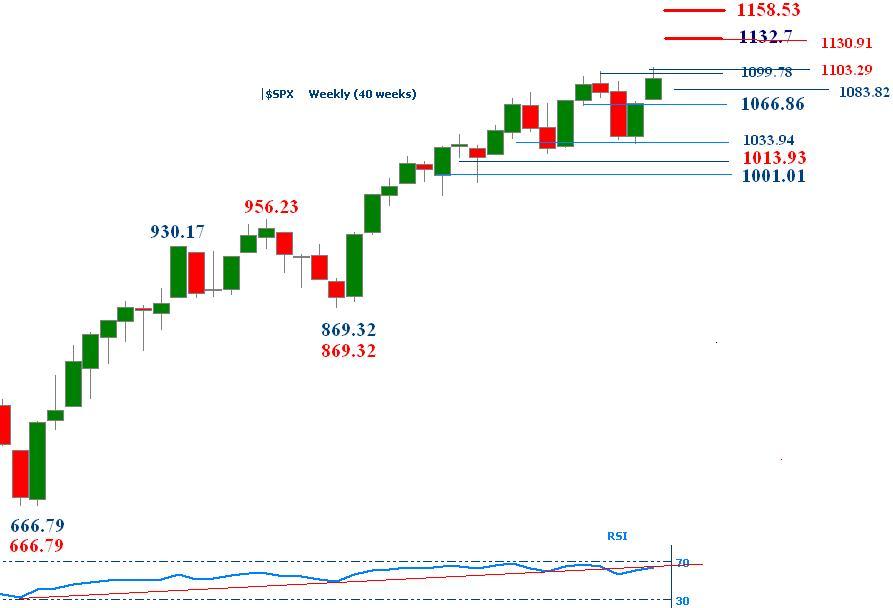
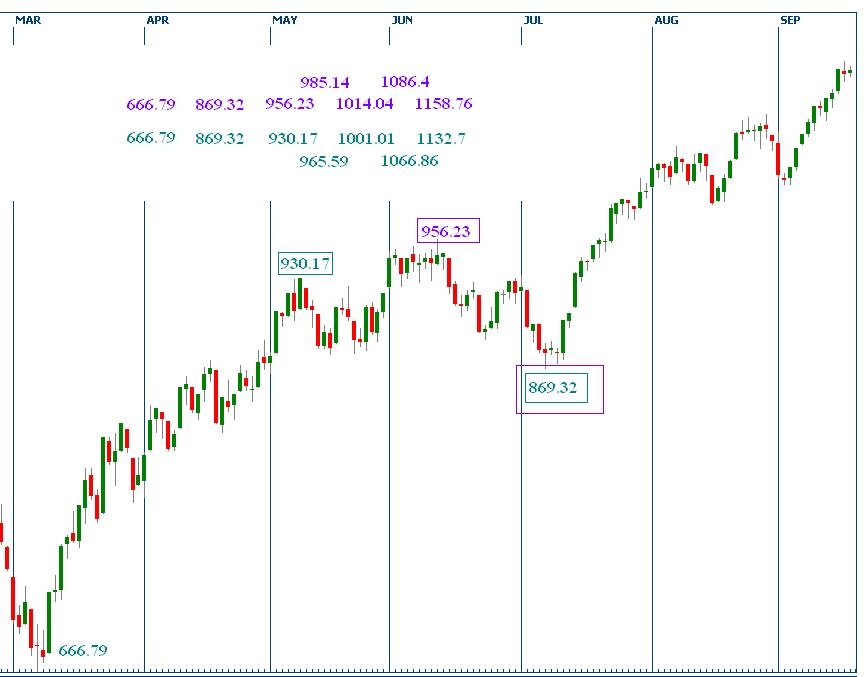
Numbers in the following table came from This chart (Sep 20 2009, 11:35 PM). The noteworthy point is 1066.86, it is the middle point in between 1001.1 an d 1132.7.
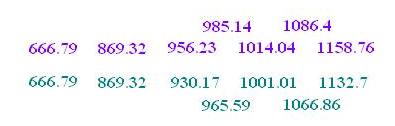
The upper limit, 1132.7 is a shocking coincidence with the Saturn Ring ratio projection,
(details). Using the Saturn Ring ratio 0.7194007 with reference frame [1313:667], it comes out 1132 too.
Another coincidence is the peak 1101.36 observed on 11/21. Using Saturn Ring ratio 0.8093579 and 0.7951999, pivotal points are 1103 & 1009, the mean value is 1101.
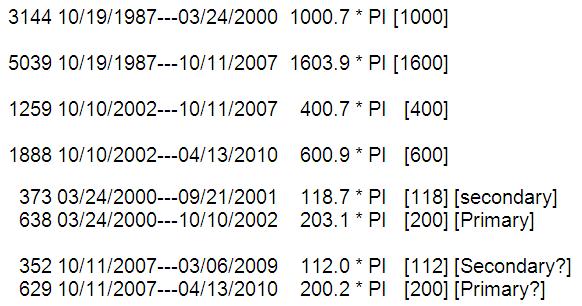
Extensions
(956-667) * 0.8093579 + 869 = 1103
(956-667) * 0.7951999 + 869 = 1099
In order to probe the middle term trajectory, please refer to this post, Oct 5 2009, 12:20 PM. Two projection made in this post, Oct 24 2009, 02:45 PM . I updated the Long PI multiples table too. Unfortunately, so far the Dar market did not hint whether 04/13/2010 is a high or low


