Bought back my faz this morning at 18.9. I think this rally is a fake out. Daily still looks like a sell here. Hourly overbought taken care of. We should know more by end of day. I think this rally will fade.Add XLF to the non-confirmation list.

SPX
#11

Posted 23 November 2009 - 10:30 AM
#12

Posted 23 November 2009 - 10:33 AM
I think it's a fake out but if it does not fall here today. I am ok with it. I can wait...Bought back my faz this morning at 18.9. I think this rally is a fake out. Daily still looks like a sell here. Hourly overbought taken care of. We should know more by end of day. I think this rally will fade.Add XLF to the non-confirmation list.
#13

Posted 23 November 2009 - 10:37 AM
Edited by NAV, 23 November 2009 - 10:38 AM.
#14

Posted 23 November 2009 - 10:48 AM
If you're using the data at Yahoo its been corrupted since the NYSE and AMEX merger and should be tossed.NYSE adv 3,043 (86%) decl 454 (13%)
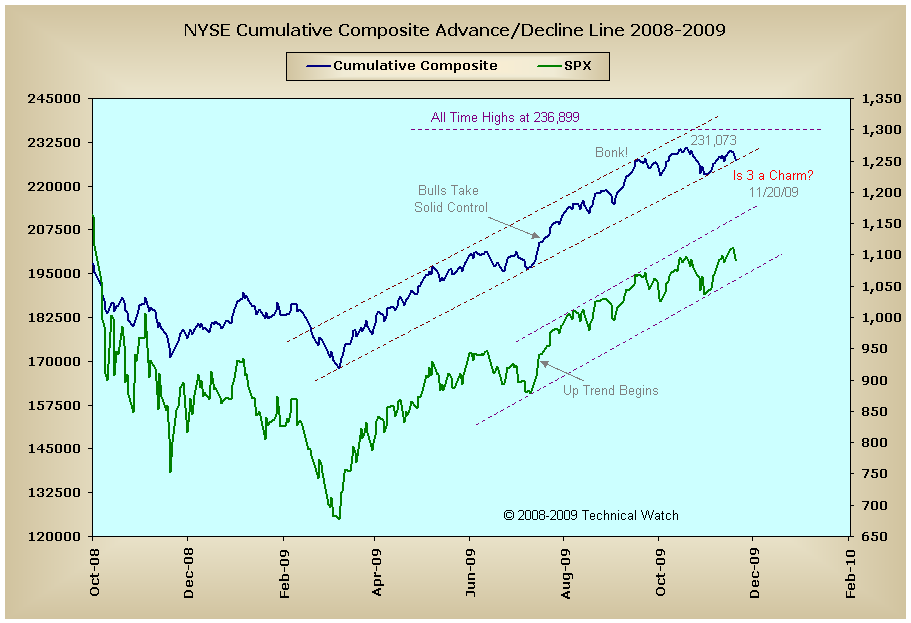
Actual NYSE A/D at 10:45 is 2535/322. As of last Friday we need 9569 data points on the raw NYSE A/D line to reach the all time highs.
Fib
Better to ignore me than abhor me.
“Wise men don't need advice. Fools won't take it” - Benjamin Franklin
"Beware of false knowledge; it is more dangerous than ignorance" - George Bernard Shaw
Demagogue: A leader who makes use of popular prejudices, false claims and promises in order to gain power.
Technical Watch Subscriptions
#15

Posted 23 November 2009 - 10:59 AM
If you're using the data at Yahoo its been corrupted since the NYSE and AMEX merger and should be tossed.NYSE adv 3,043 (86%) decl 454 (13%)
Actual NYSE A/D at 10:45 is 2535/322.
Fib
What about stockcharts.com cumulative A/D line ? Is that accurate ?
As of last Friday we need 9569 data points on the raw NYSE A/D line to reach the all time highs.
Are you sure ? What's your source ?
According to stockcharts.com data, as of last friday, we required about 3700 points to make new recovery highs.
P.S - I see you are talking about all time highs. I was talking about new recovery highs above the Oct highs.
Edited by NAV, 23 November 2009 - 11:06 AM.
#16

Posted 23 November 2009 - 11:08 AM
A DOG ALWAYS OFFERS UNCONDITIONAL LOVE. CATS HAVE TO THINK ABOUT IT!!
#17

Posted 23 November 2009 - 11:15 AM
I'm as sure as I can be...the Wall Street Journal. The data is free and can be found here (left side, a 1/4 way down).Are you sure ? What's your source ?
The information that Stock Charts has been getting from Thomson has also been "off" for many months now. This is why I have taken it upon myself to track the data on the TICKQ as it showed the most blatant of errors last fall. I made a post on this last year in warning those who use Stock Charts to be cautious in anything breadth related. It should be stressed that (at this time) the structures of the A/D lines are fine, but it's the amplitudes that are in error (and woefully so).
The key to all of this though is consistency, and many data sources have had their problems in 2008 between the merger and the crash. I have found that the Wall Street Journal data has shown the best historical correspondence to the actual price data.
Below is the raw NYSE A/D line through last Friday for your further review.
Fib

Better to ignore me than abhor me.
“Wise men don't need advice. Fools won't take it” - Benjamin Franklin
"Beware of false knowledge; it is more dangerous than ignorance" - George Bernard Shaw
Demagogue: A leader who makes use of popular prejudices, false claims and promises in order to gain power.
Technical Watch Subscriptions
#18

Posted 23 November 2009 - 11:24 AM
I'm as sure as I can be...the Wall Street Journal. The data is free and can be found here (left side, a 1/4 way down).Are you sure ? What's your source ?
The information that Stock Charts has been getting from Thomson has also been "off" for many months now. This is why I have taken it upon myself to track the data on the TICKQ as it showed the most blatant of errors last fall. I made a post on this last year in warning those who use Stock Charts to be cautious in anything breadth related. It should be stressed that (at this time) the structures of the A/D lines are fine, but it's the amplitudes that are in error (and woefully so).
The key to all of this though is consistency, and many data sources have had their problems in 2008 between the merger and the crash. I have found that the Wall Street Journal data has shown the best historical correspondence to the actual price data.
Below is the raw NYSE A/D line through last Friday for your further review.
Fib
Thanks Fib.
Now, it sucks, when you can't rely on these charting services !
Edited by NAV, 23 November 2009 - 11:25 AM.
#19

Posted 23 November 2009 - 11:30 AM
Edited by SuperSwing, 23 November 2009 - 11:32 AM.
#20

Posted 23 November 2009 - 11:39 AM
Would you please clarify what you mean.The average of A/D line is about 2000 lately.
What data and what source are you referring to.
Thanks in advance.
mss
A DOG ALWAYS OFFERS UNCONDITIONAL LOVE. CATS HAVE TO THINK ABOUT IT!!


