Jump to content


Photo

Crafting the rhythms


  • Please log in to reply
140 replies to this topic

#11 stanley

stanley

    Member

  • Traders-Talk User
  • 167 posts

Posted 17 June 2010 - 03:12 PM

brief summary

intraday range
06/17 1105.87 - 1117.72
06/16 1107.13 - 1118.74

Index bounced off 1042.17 on 06/08. Now it enters the intraday target zones, breaches the lower side of the near term target zone.

1107.18 = [0.500 | 1040.78:1173.57 ]
1117.35 = [0.577 | 1040.78:1173.57 ] ( 0.57735 = sqrt(3)/3 )
1122.84 = [0.618 | 1040.78:1173.57 ]
1134.66 = [0.707 | 1040.78:1173.57 ]

1085=[0.382|1220:869]
1137=[0.236|1220:869]

etrade.JPG
http://clearstation....ils?Symbol=_INX

Archive:
---------------------------------------------
Jun 5 2010, 08:22 PM
( key zones in the chart [1122,1107] [1039,1036] ) if this secondary low is still ahead, it could be in between 06/07 and 06/30.
http://traders-talk....-1275787318.jpg

03/06/09 BASE 0666.79
07/08/09 85TD 0869.32
11/02/09 82TD 1019.95
02/05/10 64TD 1044.50
05/25/10 74TD 1040.78
06/08/10 83TD 1042.17
06/30/10 99TD ????.??

May 22 2010, 10:36 PM
1086 comes from the frame [0.382 | 869: 1220]. For a safer confirmation, wait index closing above 1117 [gap 1113.71-1107.34]. After the safer confirmation, the speculation effort may focus on the middle term trajectory.
Beyond near term:
After a few weeks respite period. market enters another chaos. Time window is around [07/30-08/10]–09/27. The possible upper rails: 1138-1157 or 1176-1186, posible lower rails: 1014 or 948.
---------------------------------------------

#12 stanley

stanley

    Member

  • Traders-Talk User
  • 167 posts

Posted 18 June 2010 - 12:29 PM

Pickled cucumbers
series 1, 06/12/10

Even though the “Stock Picks & Pans” may be a more popular title, Let me try “Picked cucumbers”.

[not for scalp, Do your own DD]

PUDA
pd.JPG
http://www.pudacoalinc.com/
Puda Coal, Inc., through its operating subsidiary, Shanxi Puda Coal Group Co., Ltd., specializes in providing premium grade cleaned coking coal to the steel manufacturing industry for the use in making coke in China. Headquartered in Taiyuan City in the Shanxi Province, the Company currently has three coal washing facilities with annual coal washing capacity of 3.5 million metric tons. Shanxi Province provides 20-25% of China's coal output and supplies nearly 50% of China's coke.

Corporate profile

Coking coal prices may hike 50 pct on strong Chinese demand
(en.sxcoal.com)
Updated: 2010-05-19 14:53
http://www.chinamini...2046d36303.html
CRISIL Research expects coking coal prices to increase by more than 50% from the average of US$150 per tonne a year ago, to US$230-240 per tonne in 2010, and further to US$270-280 per tonne in 2011.
China, which accounts for almost half the world's coking coal consumption, will face an increasing shortage over the next two years.

China's imports drive rising coking coal prices: CRISIL Research
May 18, 2010 Mumbai
http://www.crisil.co...l-pr_180510.pdf

Puda Coal Announces Strong First Quarter 2010 Results
Press Release Source: Puda Coal, Inc. On Thursday May 13, 2010, 7:30 am EDT
link

PUDA COAL, INC. Financials

SEC Filings for PUDA COAL INC (PUDA)

Beta: 2.80
52-Week High (Apr 7, 2010)3: 11.90
52-Week Low (Aug 5, 2009)3: 0.83
Key Statistics

#13 stanley

stanley

    Member

  • Traders-Talk User
  • 167 posts

Posted 22 June 2010 - 10:58 PM

Pickled cucumbers

Even though the “Stock Picks & Pans” may be a more popular title, Let me try “Pickled cucumbers”.

[not for scalp, Do your own DD]

1 06/12/10 PUDA
2 06/19/10 CISG
3 06/22/10 IPSU

CNinsure Inc. (Nasdaq: CISG)
Company Overview
CNinsure Inc is a leading independent insurance intermediary company operating in China. It distributes a wide variety of property and casualty insurance products and life insurance products underwritten by both domestic and foreign insurance companies operating in China, and offer insurance claims adjusting services, such as assessment, survey, authentication and loss estimation, as well as other insurance-related services to individuals and institutions. As an insurance intermediary, the Company is not exposed to any underwriting risks.
Home Page

CNinsure Announces the Establishment of Its Insurance Brokerage Business Unit
June 1, 2010 link

CNinsure Announces Strategic Partnership with Taiping General
May 27, 2010 link

Life insurance sales boost CNinsure profit 48 pct
May 24, 2010 link

Financial Reports

Prospectus


Imperial Sugar Co. (Nasdaq: IPSU)
IPSU.JPG
Imperial Sugar® Company is the producer of products under the labels of Imperial Pure Cane Sugar®, Dixie Crystals® and Holly® Imperial Sugar Company always strives to bring you only the finest quality sugar and sweetener products. Imperial Sugar® products, great recipes and excellent service have been available to Texans for over 100 years. The Dixie Crystals® brand has been supplying the same great product to folks in the southeast since 1917.
Home page

Key Statistics

New Record for Sugar Shipped in One Day
iscnewsroom | Jun 21, 2010
It was a Friday in May, and in Imperial Sugar’s Port Wentworth warehouse, employees were bustling and trucks were lined up to be loaded with pallets of sugar.
the warehouse loaded and shipped out 71 truckloads of sugar for distribution – a new record for the rebuilt refinery.
To the warehouse team, it felt like old times.
Before the 2008 explosion at Port Wentworth, it wasn’t unusual for the team to load up to double that amount of sugar during a shift.
Link

Huge Cane Production Deficit In India And Strong Domestic Biofuel Demand In Brazil, Continue To Increase Sugar Prices In South America And Spur Demand
Monday June 14, 2010
link

Imperial Sugar Is My Next 'Ten Bagger'
June 22, 2010
link

Imperial Letdown
May 25, 2010 By Gerard Torres
Imperial Sugar appeared to be poised for big things in the near future. Management previously stated that decreased sales volumes (because of an explosion at one of its large refineries two years ago) would end when the refinery's reconstruction, scheduled for this past January, finished.
link

Imperial Sugar fiscal 2nd-quarter loss widens
Monday May 10, 2010, 1:36 pm EDT
SUGAR LAND, Texas (AP) -- Imperial Sugar Co. said Monday that its second-quarter loss widened as the company suffered derivatives setbacks and problems at a refinery.
link

#14 stanley

stanley

    Member

  • Traders-Talk User
  • 167 posts

Posted 23 June 2010 - 11:41 AM

06/23/10 SPX near term update

index hit 1042.17 [target 1039.28] on 06/08 then bounced up.
index hit 1131.23 [target 1134.66] on 06/21 then reversed down.

comments: 1085/1086 is a critical pivot for the next few weeks. the intermediate frame wave structure does not manifests itself.

Archive
-----------------------------------------------------------
Jun 5 2010, 06:22 PM
link

if this secondary low is still ahead, it could be in between 06/07 and 06/30.
03/06/09 BASE 0666.79
07/08/09 85TD 0869.32
11/02/09 82TD 1019.95
02/05/10 64TD 1044.50
05/25/10 74TD 1040.78
06/08/10 83TD 1042.17 [data entry after 06/05]
06/30/10 99TD ????.??

This poster believes it is the market underlying intrinsic value determines the wave structure, the speculation reliability from the wave extrapolation is very limited. At this moment, the wave structure in the large scale time frame remains bullish. the intermediate frame wave structure does not manifests itself.

May 22 2010, 10:36 PM
link
1086 comes from the frame [0.382 | 869: 1220]. For a safer confirmation, wait index closing above 1117 . After the safer confirmation, the speculation effort may focus on the middle term trajectory.
Beyond near term:
After a few weeks respite period. market enters another chaos. Time window is around [07/30-08/10]–09/27. The possible upper rails: 1138-1157 or 1176-1186, possible lower rails: 1014 or 948.

chart as of 06/23 9:45am
spx06232010.JPG

#15 stanley

stanley

    Member

  • Traders-Talk User
  • 167 posts

Posted 24 June 2010 - 12:39 PM

06/24 Updates - some intraday observation

(posted here (7:53am PDT) originally.)
Bear takes out pivot 1085/1086. The index slips below 1076.19 [0.618] and struggles to regain the pivot.
There are 5 trading days (includes 06/24) to see if the secondary low is still ahead. Index drops below 1065 in the next 1/2 sessions the trend is becoming decisive.
construct your own version of the trajectory & compare with the the Market's. Have a fun.

From prior post: [June 23 2010 09:41 AM]
1085/1086 is a critical pivot for the next few weeks. the intermediate frame wave structure does not manifests itself.

if this secondary low is still ahead, it could be in between 06/07 and 06/30.
03/06/09 BASE 0666.79
07/08/09 85TD 0869.32
11/02/09 82TD 1019.95
02/05/10 64TD 1044.50
05/25/10 74TD 1040.78
06/08/10 83TD 1042.17 [data entry after 06/05]
06/30/10 99TD ????.??

May 22 2010, 10:36 PM
Beyond near term:
Time window is around [07/30-08/10]–09/27. The possible lower rails: 1014 or 948.

spx06242010.JPG

#16 stanley

stanley

    Member

  • Traders-Talk User
  • 167 posts

Posted 27 June 2010 - 08:27 PM

Crafting the rhythms series 06/27
- Surprises & Volatilities That Lay Ahead in the Second Half of 2010

Near term:

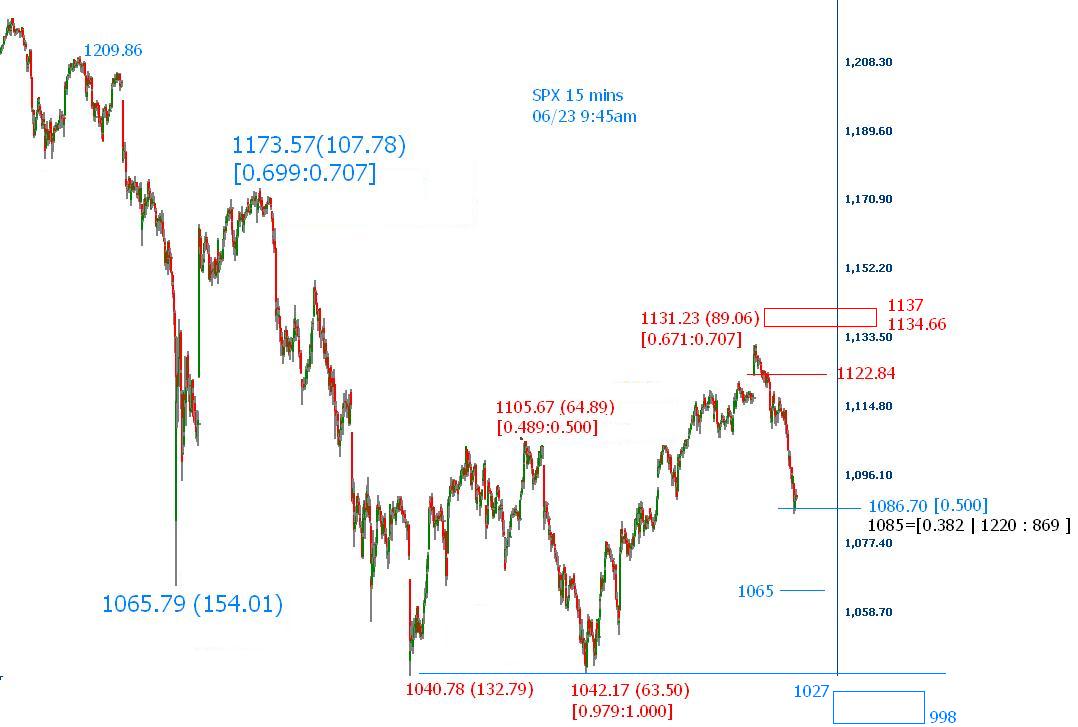
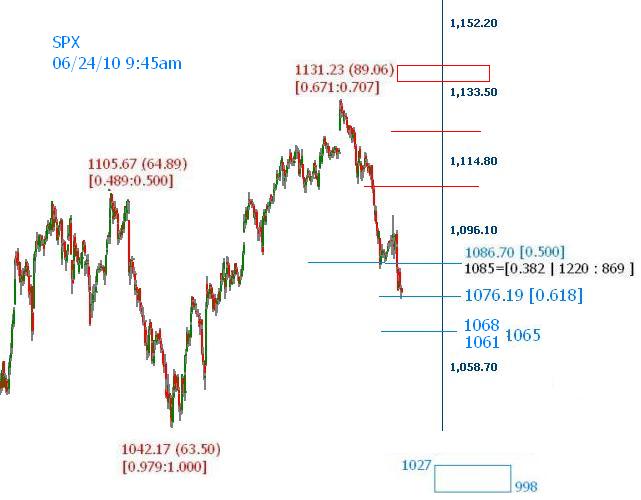
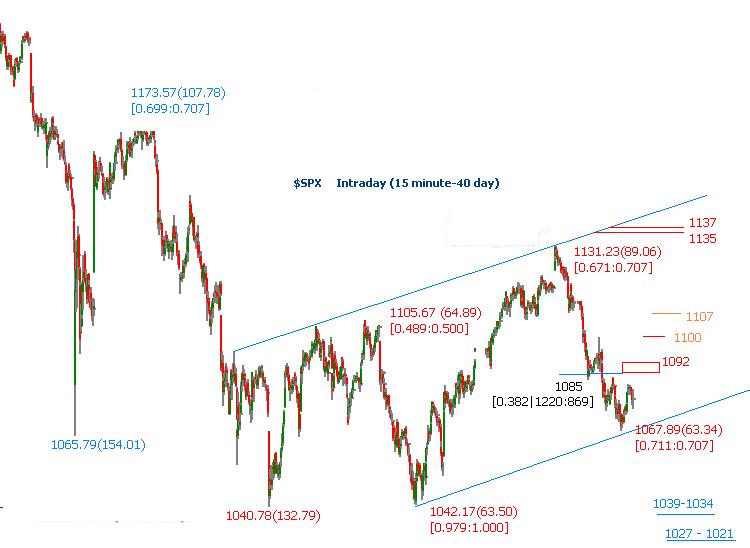
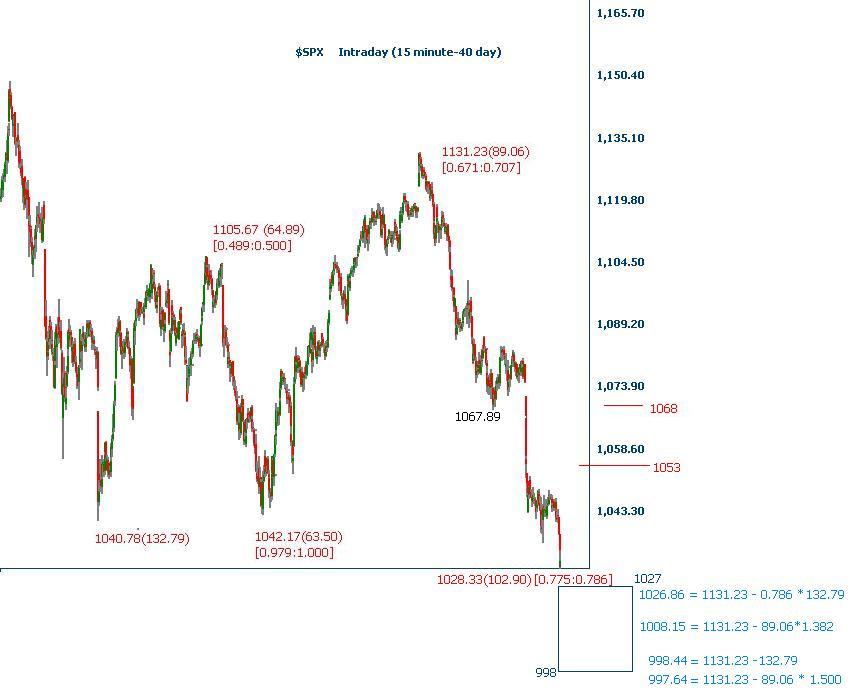
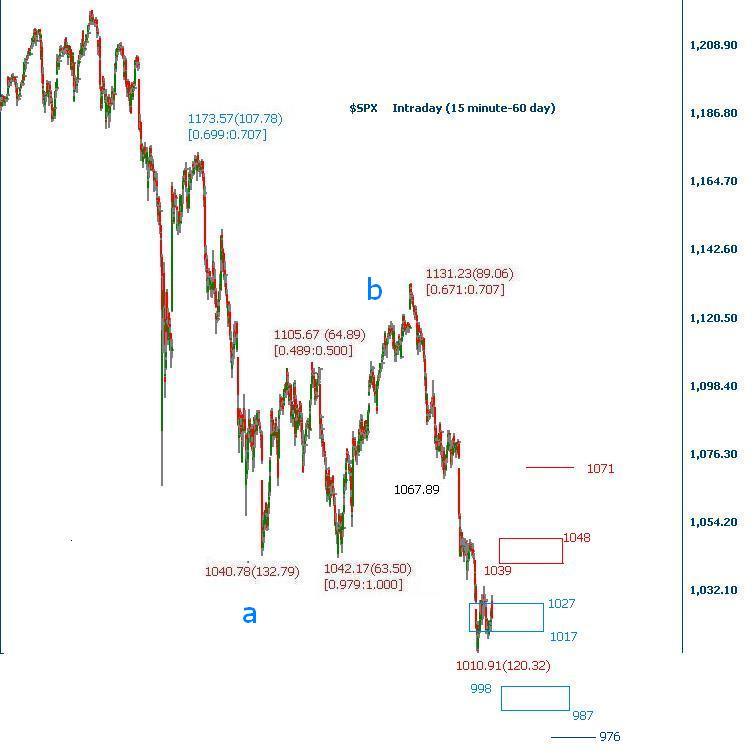
From the chart shown below, a seemingly rational trend line served as a support so the Index marked an Intraday low 1067.89 then bounced up. Not an unexpected skirmish. Counting from the recent high 1131.23 on 06/21, index deployed another ratio 0.707 ( 0.707 * 0.707 = 0.5), the third one that index has deployed recently. The same chart also labeled the nearby supports & resistances. these numbers were based on short term reference frame, will need to be adjusted accordingly. The short term bias is towards positive movement. Without a surprise, the cryptic
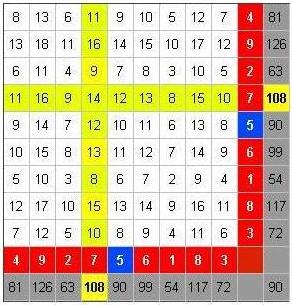
 King Wen’s sequence (in this chart) probably had assigned 72 (actual 74) or 81 (actual 83) as the target. A secondary low is behind us. Use Time stamp 06/08, the next terminal Low is at least 54-63 trading days away. [54:08/24, 63:09/07, 72: 09/20, 81:10/01]. Apparently, such assessment is speculative and couples with contradiction, let’s move on ....

03/06/09 BASE 0666.79
07/08/09 85TD 0869.32
11/02/09 82TD 1019.95
02/05/10 64TD 1044.50
05/25/10 74TD 1040.78
06/08/10 83TD 1042.17
06/30/10 99TD ????.?? chance to see a secondary low in this time window is fading

spx06252010a.JPG


To Probe Further:

-----------------------------------------
Oct 24 2009, 02:45 PM
link to post #19
The Grand Cross and An Alignment for Our Times
----- A T-Cross on July 30
----- The Grand Cross on August 6
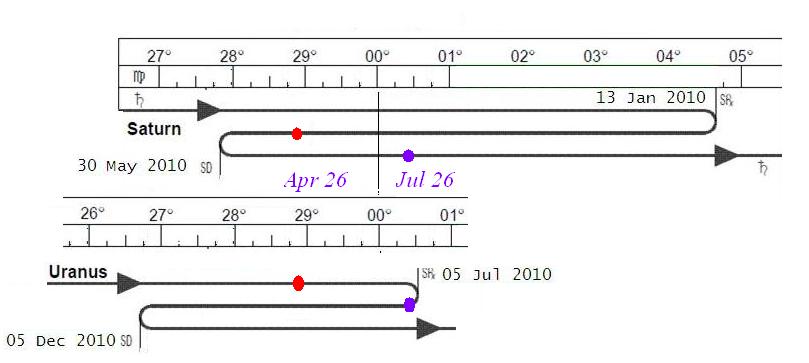
----- The Saturn-Uranus opposition – 5 alignments in 2008-2010, No.5 07/26/10
(1) 11/04/08
(2) 02/05/09
(3) 09/15/09
(4) 04/26/10
(5) 07/26/10

Feb 6 2010, 04:48 PM
link
To explore the 2010 market trend, I divide the speculation focuses into two time zones. The first part is from 01/18 to 04/26. the second part is from 07/26 to 09/17. The month of May and June serves as a fulcrum that bridge the two time zones.

Jun 5 2010, 06:22 PM
This poster believes it is the market underlying intrinsic value determines the wave structure, ..... At this moment, the wave structure in the large scale time frame remains bullish. the intermediate frame wave structure does not manifest itself.
-----------------------------------------

The earnings announcement window is upon us, see if there is any warning or surprise in their outlooks. Bullish speculator can do the hype beforehand but reality authenticate the claim. The bet depends on how much realization a speculator has gained in the fundamental front.

Second half may be full of surprises & volatilities, not only due to geopolitical tensions but also some life time Astro events. You see the 4th Opposition between Saturn-Uranus on 04/26 marking the end of the Feb/March rally. The last such Opposition is due on 07/26. The chart I plotted (well, cut, edit, & paste) in this link indicated the movement direction is against each other, the exact message is so indiscernible. I am not an astrologer but let me reiterate one more time that we need some entertainments in this fascinating market. and “Technical analysis is a windsock, not a crystal ball” [Carl Swenlin]

Posted Image

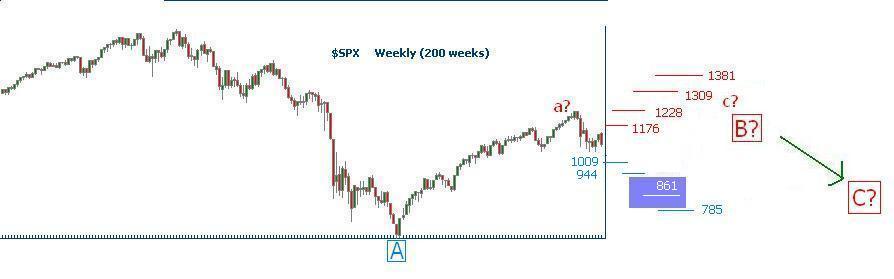
Larger frame pullback targets:
Bull has gained “enough” high terrain so that a regular 0.382 pullback from 1220 only can reach 1009 [frame 667:1221], 0.5 @944. 1K is a psycho mark, its nearby is a FIB cluster.

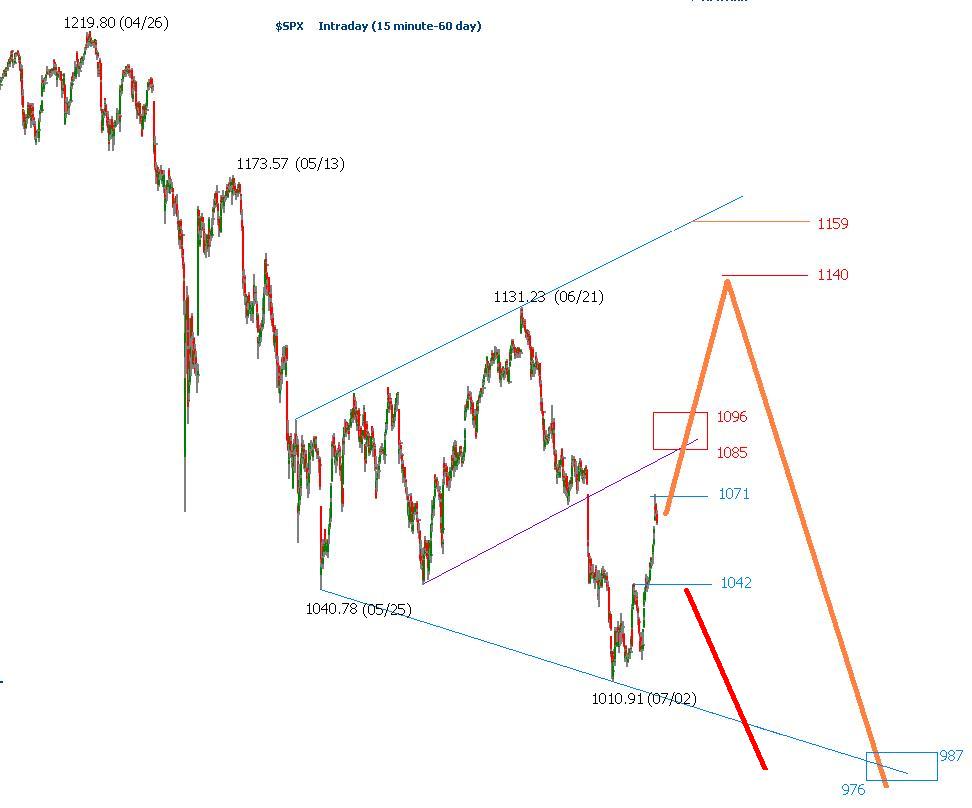
The middle term wave structure is ambiguous so it is premature to pick a number to gauge whether the rally since March 2009 is complete or not. The following chart embedded with quite a few scenarios. Any way, in between July/August, index will deploy enough trajectory for speculator to determine the status of the primary wave B. Be flexible, Wave count is subjective also evolves with time.

SPX2ndhalf.JPG

Archives:
-----------------------------------------
May 22 2010, 08:36 PM
Post #7 in this thread
After a few weeks respite period. market enters another chaos. Time window is around [07/30-08/10]–09/27. The possible upper rails: 1138-1157 or 1176-1186, possible lower rails: 1014 or 948.

Apr 13 2010, 10:58 AM
Post #1 in this thread
When index exceeds 1256.98 (refer to the chart shown below) the wave status since March 09 may “separate” from the prior one (1756-->667) and become an individual segment . When the wave is becoming a separate segment, it is capable of reaching 1300 level. The half power point 0.707 from 667 to 1576 is 1310, very close to the High 1313.15 marked on 08/11/08.

Posted Image

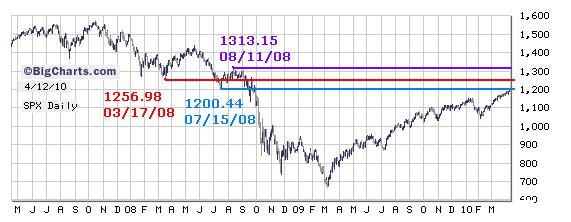
In late September, I picked two retracement references out of [667:1575] for speculation:
1122 is the 50% retracement, before index took out 1132 decisively, there was a month long tough fight in the zone 1086-1132. 1229 is the 61.8% retracements, Zone 1195 to 1229 should be another battle field.
-----------------------------------------

#17 stanley

stanley

    Member

  • Traders-Talk User
  • 167 posts

Posted 29 June 2010 - 11:24 AM

06/29 intraday 1042.52 @ this writing.

The support is at 1039-1037. Use frame 1040.78:1131.23, L132.79, resistance is at 1049.17 then 1064.84. A Pivot 1027 to see 1009 [998-1027]. King Wen Sequence 99 is due tomorrow, Its "Primiary" number is 108, in margin of the 105-109 trading day cycle. Secondary Bradley Turn 07/08.

Bear is anxious to see a new low. Such anxiety reminds me the old story I brought out long time ago. In short: there is only 7 bananas in the kitchen, in between 3 & 4, should cooker deliver 3 for lunch or 3 for dinner?

------------------------------------

Jun 6 2010, 10:30 AM
Onset, Another conflicting zone
Posted Image

Jun 27 2010, 06:27 PM
Crafting the rhythms series 06/27
- Surprises & Volatilities That Lay Ahead in the Second Half of 2010

The short term bias is towards positive movement. Without a surprise, the cryptic King Wen’s sequence (in this chart) probably had assigned 72 (actual 74) or 81 (actual 83) as the target. A secondary low is behind us. Use Time stamp 06/08, the next terminal Low is at least 54-63 trading days away. [54:08/24, 63:09/07, 72: 09/20, 81:10/01]. Apparently, such assessment is speculative and couples with contradiction .......

03/06/09 BASE 0666.79
07/08/09 85TD 0869.32
11/02/09 82TD 1019.95
02/05/10 64TD 1044.50
05/25/10 74TD 1040.78
06/08/10 83TD 1042.17
06/30/10 99TD ????.?? chance to see a secondary low in this time window is fading

#18 stanley

stanley

    Member

  • Traders-Talk User
  • 167 posts

Posted 30 June 2010 - 10:42 PM

Crafting the rhythms series 06/30/10

------------------------------------------------------------------------
Prior post Jun 27 2010, 09:24 AM Post #17

Use frame 1040.78:1131.23, L132.79, resistance is at 1049.17 then 1064.84.
A Pivot 1027 to see 1009 [998-1027].
King Wen Sequence 99 is due 06/30. Its "Primary" number is 108, in margin of the 105-109 trading day cycle.
Secondary Bradley Turn 07/08.
------------------------------------------------------------------------

Retracements/Extensions:

06/30 Session range 1028.33 - 1048.08. The pivot is only 1.33 points below the session low.

The pre calculated numbers in Jun 23’s chart are annotated in the following chart.
Use the latest data points, resistance is 1053 and 1068.
SPX06302010.JPG

1K & its nearby is a FIB cluster zone.
May 25 2010, 11:31 AM
Posted Image

King Wen Sequence [81,126,63,109,90,99,54,117,72]
03/06/09 BASE 0666.79
07/08/09 85TD 0869.32
11/02/09 82TD 1019.95
02/05/10 64TD 1044.50
06/30/10 99TD 1028.33
07/14/10 108? ????

Probing further:

comment: 1K and 950 has been addressed couples times in the past 6 months.
Dec 31 2009, 01:51 PM
The key zone to watch is 1014-1001 and 948-962.

comment: 785 is a pretty tough gauge. [to be elaborated]
Jun 27 2010, 06:27 PM
Posted Image

comment: 944, 861
Planet Yelnick Tuesday, June 29, 2010
Goldman this morning was setting the bar at Sp 1040, saying if we broke below the next stop would be Sp 865

#19 stanley

stanley

    Member

  • Traders-Talk User
  • 167 posts

Posted 05 July 2010 - 08:36 PM

Crafting the rhythms series 07/05/10

Brief reviews:
Index met with the first middle term target (around 1008). On 07/01, index marked an intraday low 1010.91.
The second target is around 944-948.

Intraday speculation:
Resistance zone 1039-1048, 1071. supports 1008-998, 976.
spx070210.JPG

Overall comments:
The latest down leg (06/21-07/01) traveled 0.906 of the First down leg [04/26-05/25, length 132.79]. An equal length movement will put index at 998. So, the movement is incomplete. However, wave theory only provides a thought process, Market index obeys its own law; Time is a magnificent machine working out these overhang saga; Whether an event will transpire can be “perceived” by a gauge or pivot. The usage is not only works in the movement polarity but also for the displacement.

Fibonacci retracement & Time Zone ratio:

( a ) Retracement

Large frame
1220-0667 0.382 1008
1220-0667 0.500 0944
1220-0667 0.786 0785 travels down to this level marks the end of the rally since March 09.
0667-1576 0.786 0861

FIB Map
May 25 2010, 11:31 AM
Posted Image

Jun 27 2010, 06:27 PM
Posted Image

( b ) Time Zone ratio

There are 352 trading days in between 10/11/07 (1576.09) and 03/06/09 (666.79)
Another 352 trading days from 03/06/09 maps to 07/30/10 [+/-?], Time zone ratio 1.0.

King Wen’s Sequence

[81,126,63,108,90,99,54,117,72], Numbers occurrence is in a non-sequential order.

[1] The 108 in King Wen's Sequence By J.M. Berger
http://iching.egople.../hidden108.html
[2] The King Wen sequence (文王卦序, King Wen hexagrams divination sequence)
http://en.wikipedia....ng_Wen_sequence
[3] King Wen: Change And Symmetry
http://iching.egople...w-symmetry.html

03/06/09 BASE
07/08/09 85TD 0869.32
11/02/09 82TD 1019.95
02/05/10 64TD 1044.50
07/01/10 101D 1010.91
07/14/10 108 this overlaps with 108 Trading day cycle
07/27/10 117
08/09/10 126

Long PI details

04/15/10 actual 04/26, error 2.2PI. index deployed a middle term High
09/17/10 realigned to 10/19 [+/- 4PI]

Astro events
[Your own Browsing efforts]

#20 stanley

stanley

    Member

  • Traders-Talk User
  • 167 posts

Posted 08 July 2010 - 01:44 PM

Crafting the rhythms series 07/08/10

On 07/08, session high is 1071.25 @ this writing. A 0.5 retracement is neutral, 1071.07 = [0.5|1010.91:1131.23]). The critical pivots to gauge the direction is 1096 [up] and 1042 [down].
Earnings announcement window kicks off soon, plus, with some who knows catalyst may jump out..... Which direction the index will head to? Chart does not manifest itself, but, the index status on 07/26 is becoming exciting.

High
03/06/09 BASE
06/11/09 67TD 0939.04
10/21/09 91TD 1101.36
01/19/10 59TD 1150.45
04/26/10 66TD 1219.80
07/26/10 63TD ????

Low
03/06/09 BASE
07/08/09 85TD 0869.32
11/02/09 82TD 1019.95
02/05/10 64TD 1044.50
07/01/10 101D 1010.91
07/14/10 108? this overlaps with 108 Trading day cycle
07/27/10 117?
08/09/10 126?

Feb 6 2010, 04:48 PM
link
To explore the 2010 market trend, I divide the speculation focuses into two time zones. The first part is from 01/18 to 04/26. the second part is from 07/26 to 09/17(27). The month of May and June serves as a fulcrum that bridge the two time zones.

May 17 2010, 10:32 PM
link
Fibonacci Time Zone (ratio 1.00) due 07/30/10[-08/10/10].

May 22 2010, 08:36 PM
link
After a few weeks respite period. market enters another chaos. Time window is around [07/30-08/10]–09/27. The possible upper rails: 1138-1157 or 1176-1186, possible lower rails: 1014 or 948.

spx07082010.JPG