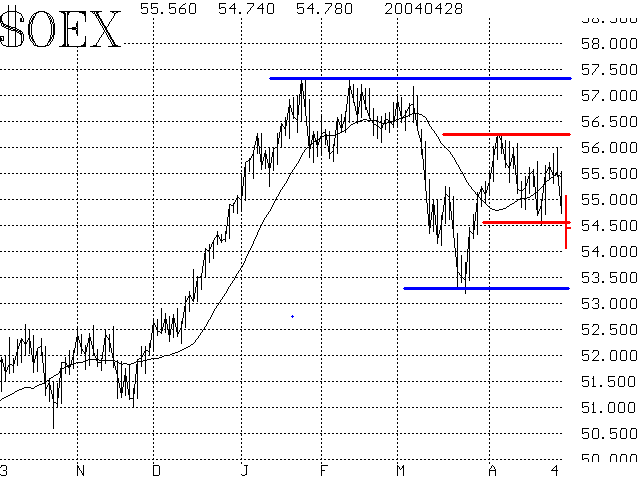
This market has been characterized by a lack of follow-through since January -- in both directions. That hypothesis is about to be tested again right now, as the market has broken below support. Ordinarily, I'd say that a retest of the March lows is almost a certainty. But, because of the lack of follow-through in this market so far this year, I can be as certain as normal. Still, that's the way it looks now: a retest of the March lows is in the offing. As we've often said before, this could lead to a confluence of true buy signals -- something that we haven't had since last March (2003).
Prices had been constrained within two trading ranges (see Figure 1). With Thursday's action, we are now below the support area of the inner range, and so we expect to see the market test the lows of the bigger range. Moreover, there is now so much overhead resistance that the market is going to have to have some strong buy signals in order to break through all of it. As it stands now, even if the market were to try to rally immediately, sellers would be drawn out at the previous resistance points -- believing that they now have another chance to sell, perhaps having missed it the first time (in fact, that's what resistance areas are all about, in general).
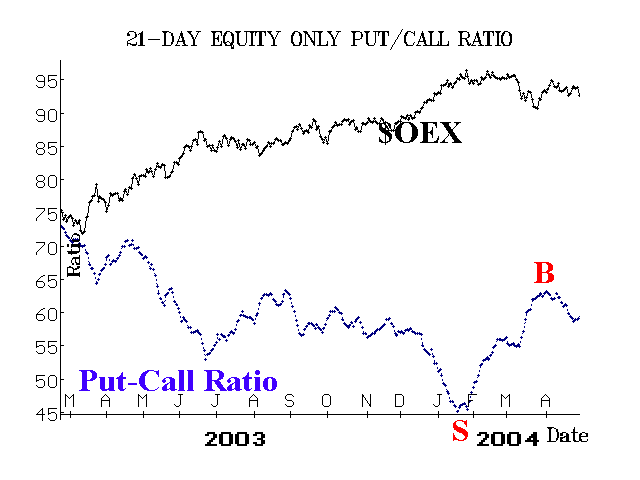
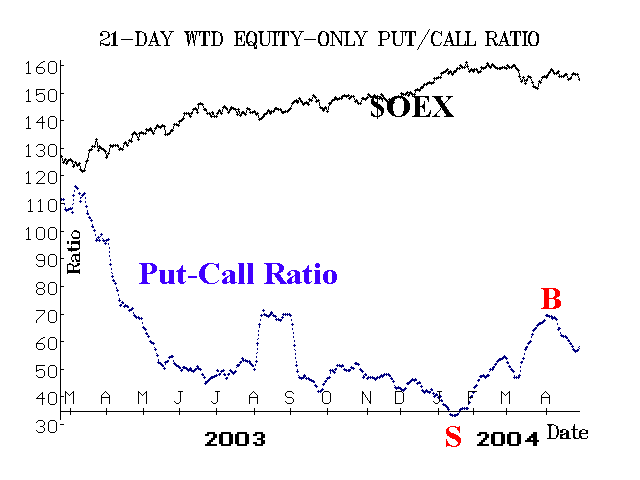
The equity-only put-call ratios have steadfastly remained on buy signals over the past couple of weeks, even while the market has struggled. However, that may be changing. If these roll over to sell signals, as they certainly could, then it augurs even more forcefully for a complete retest of theMarch lows (at least). Some of the other broad market put-call ratios which we follow, but don't put as much credence in as the equity-only ratios -- are already overbought or turning to sells. Specifically, the QQQ weighted and $OEX weighted ratios fall into this category. Market breadth has been particularly poor.
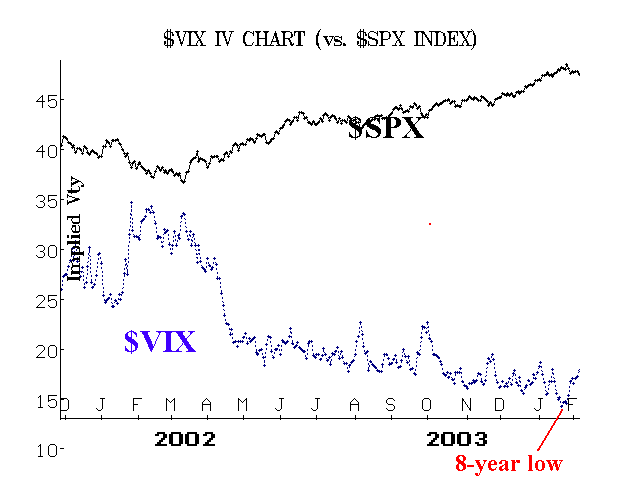
Volatility indices ($VIX and $VXO) have been rising after making 8-year lows. This is natural in that rising volatility typically accompanies a falling market, and the market has indeed been falling recently. However, it is somewhat surprising to me that the volatility indices haven't risen more than then have. When this happens, there are always two ways to look at it (the half full or half empty views). That "half full" scenario is that volatility traders aren't worried and thus neither should you be worried -- that the decline will end soon and there's no reason for panic. The "half empty" viewpoint, however, is that option traders are overly complacent and are about to learn another rude lesson about selling options at volatilities that are too low right before a big market decline.
In summary, not all of the pieces are in place for a buy signal. True, breadth is oversold, but hasn't generated a buy signal. Index prices are not near support, but would be if they fell to levels near the March lows. Volatility is not near a buy area, either, but might be if it spiked upward above 18 as the market fell. Put-call ratios signals are muddled now, but a further market decline might push them to another buy signal. In summary, as we've said before, if the market declines from here, it might actually be good (looking over the horizon) in that multiple buy signals could set up simultaneously for the first time since March, 2003. On the other hand, if the bulls get overly anxious and the bears get cold feet again, and thus the market rallies right away, then expect limited upside potential since there won't be the technical support for a rally (except for breadth, which is going to give an eventual buy signal regardless).


