As noted in the feature article, some of our technical indicators are
reaching historic proportions of "oversold." However, that still
doesn't mean that the market is ready to buy. One must wait for
specific buy signals before trying to enter this market on the long side.
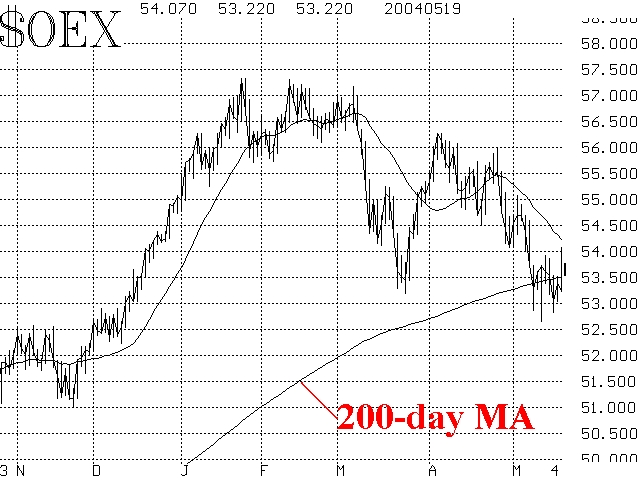
Price action has been poor. The chart of $OEX in Figure 1
shows that it's in a steep downtrend and that there are several
resistance levels overhead. The rally on Wednesday, May 19th, seemed
destined to turn things around, but it failed. So the highs in the 540
area represent resistance (as do similar highs at 1105 for $SPX and
10,100 for the Dow). Any short-term rally that closes above those
levels would be one worth buying. Also note that $OEX is near its
200-day moving average. Large institutional holders might turn to
sellers if $SPX were to close below that important average ($OEX and
the Dow already have). So, regardless of the sentiment indicators
which we'll discuss in a moment -- we do not want to be long this
market unless the major indices can overcome at least some minor
resistance. On the other hand, a further breakdown here may mean
that another down leg is necessary for base-building. That would
violate the "W bottom" theory and mean that major indices' next stop
would be the December support levels ($OEX 520-525; $SPX 1060-
1070).
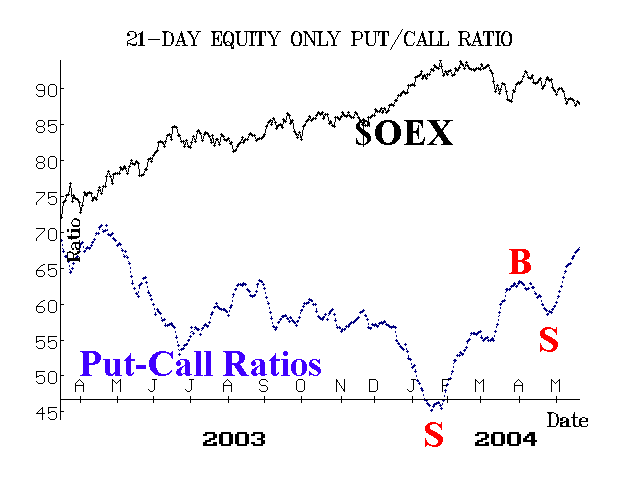
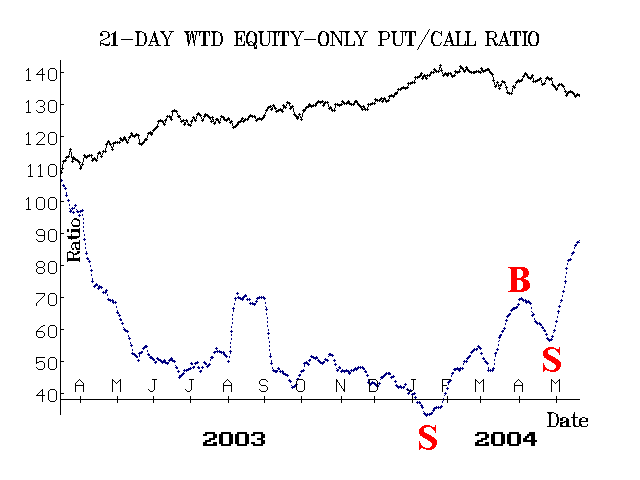
Equity-only put-call ratios continue to rise (Figures 2 & 3). While
they are high in comparison to where they've been in the past, they
will not generate buy signals until they roll over and begin to head
downward.
Market breadth has been very negative and is thus oversold.
If there are two consecutive days of strong advances over declines,
that would issue a buy signal.
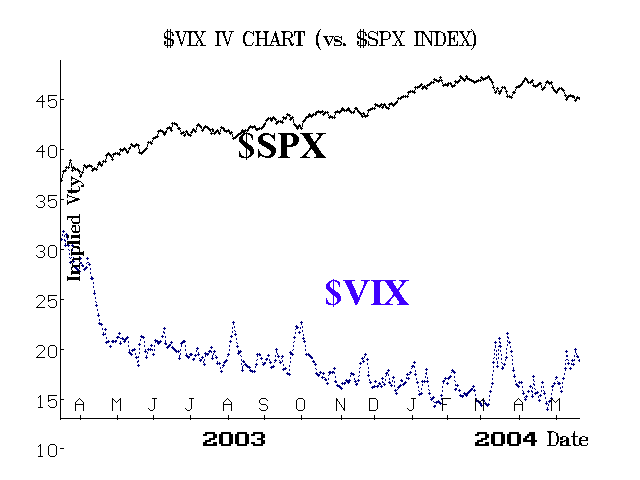
Finally, volatility indices ($VIX and $VXO) have generally been
rising -- albeit in erratic fashion. Usually a peak in volatility is formed
when $VIX declines at least 3 points from a previous high. That
hasn't happened yet. The recent $VIX high is about 20.5, so a decline
below 17.5 would mark a 20.5 as a peak in $VIX and therefore a buy
signal (see Figure 4).
To summarize: there is a lot of pessimism out there, and that has
created an oversold market. However, these things can sometimes go
to great extremes, and therefore some of the worst declines have
occurred during extreme oversold conditions. Therefore, use trailing
stops on shorts and take partial profits, but don't go long until actual
buy signals are confirmed.


