If this tool doesn't end up with a specific PRICE OUTPUT, as in a TARGET.
It is useless.
The data provided by the advance/decline is NOT an analytical tool...it provides a measurement of how much money there is for investment at any given time.
It is then up to volume to do something with this same money measurement...whether to move it in or out of the market at any given time.
As far as price targets are concerned, you then use basic supply and demand charting techniques to provide this information (symmetrical triangles, basing patterns, wedges, etc, etc.)
All of other analytical tools use the information provided by the A/D line in one way or the other to help reinforce the charting techniques.
Couldn't it also mean that it is Illiquid - there are few sellers (less stocks available for sale) therefore the few that want to buy have to pay more to find a seller - A-D goes up - not that there is a great deal of money out there chasing stocks?
Good question.
This is where using a tool like the McClellan Oscillator, and/or it's sister tool, the McClellan Summation Index is needed to identify these kinds of imbalances in this same daily liquidity dynamic.
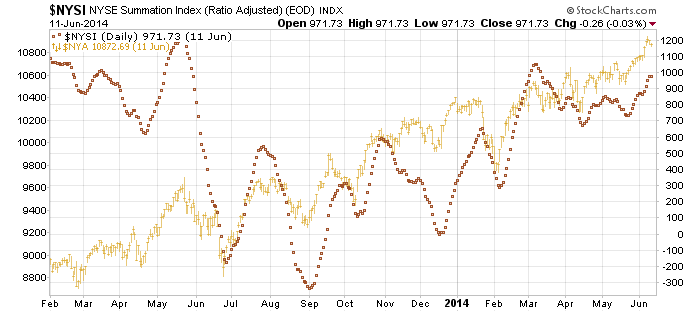
For example...take the MCSUM chart I posted earlier today and shown below. Where you see the larger separation of postings, this is where one market opinion is driving price over the other and pushing this supply to demand factor in favor of the direction noted on the chart. If the postings are congested, this is where battles go on between the two sides, and prices show sideways movements because of this.
Again...if we use a cumulative total of advancers over decliners, the TREND of money is known. The MCO then measures the speed of this trend while the MCSUM measures its trend strength.
Fib

 This topic is locked

 Next time I'll follow my hunch and not do so.


