

Alan M. Newman's Stock Market CROSSCURRENTS
Alan M. Newman, Editor Excerpts from our current issue

Rationales & Targets
The NASD released margin debt stats for the month of May on Friday and we expect to cover our views on leverage again in the July issue. Total margin debt (NASD + NYSE) remained steady at $475 billion, 2.8% of GDP. There have been only nine years when margin debt exceeded 2% of GDP. It happened in 1929 and has now occurred in eight of the last 16 years. The Fed has taken desperate measures to ensure higher stock prices for their targeted wealth effect. The accommodation of risk to the extent we see today equates to all cards played. There are no Aces left up the sleeve and risks are as high as they have ever been. While GDP is certain to improve in the second quarter now ending, any disappointment should prove quite unsettling and act as conclusive evidence the Feds policy is failing. Ironically, it will only ensure continuing accommodation as far as the eye can see.
Virtually every sentiment measure we look at is troubling. Vis-a-vis our Rydex measure, we simply divide the amount of assets in bull and sector funds by the assets in bear funds. At weeks end, the ratio was 17.6 to 1, a level we have never seen before. Despite any lip service you might see about the possibility of a correction or bear market, the bear camp is noticeably bereft of sponsors. If the Dow fades to below 16,700, the uptrend line in place from the February low will break and offer the few remaining bears evidence the long awaited reversal is at hand.
Something Is Amiss
We have seen wide and disparate estimates of the total expended on bailouts but lets go with the $29.6 trillion shown by Barry Ritholz on his Big Picture blog (see http://bit.ly/1yRuBBn). The most pertinent observation we can offer today is that the bailouts and five-and-a-quarter year long bull market have done little if anything for the consumers who drive two-thirds of the overall economy. It has instead been a boon for the financial industry and for the wealthiest in our nation. The governmental notion that there is a wealth effect clearly lacks evidence. It is with some measure of irony that after a gain of 10,000 Dow points in five years, we can report the Senates Permanent Subcommittee on Investigations is holding a hearing on Conflicts of Interest, Investor Loss of Confidence, and High Speed Trading in U.S. Stock Markets. It is also with some measure of irony that we report more wealthy Americans are giving up their citizenship than ever before to avoid taxes. What the Fed hath wrought seems to be diametrically opposed to the intent of their historic monetary accommodation. If this is what an economic recovery is about, we may very well be up the proverbial creek without a paddle.
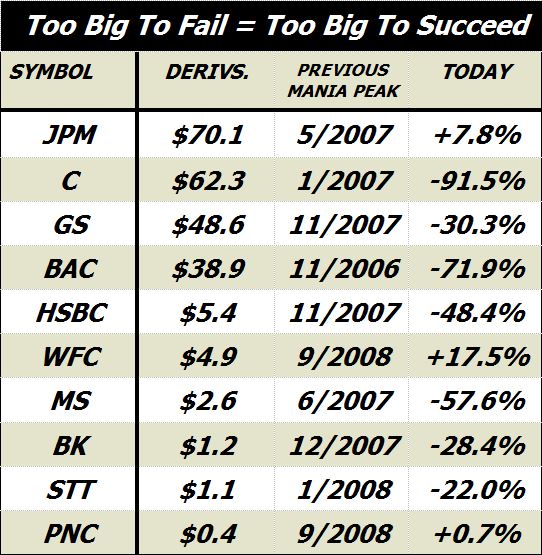
Much of the largesse has been directed at the nations financial industry and it is exceedingly troubling to see so many banks continue to trade far, far below their former highs. At center, our table shows notional values for the ten banks with the largest derivative portfolios, representing 99.4%, or $235.5 trillion of the $237 trillion total in notional values of derivatives for the banking industry (see second columntrillions of dollars). If those exposures were not sufficiently startling, consider that of the ten banks, there are only three daily charts that we would consider impressive from a technical perspective, WFC, PNC & BK. These three banks have $6.5 trillion in notional values of derivatives, 2.7% of the entire total. Of the other top ten banks, we see four neutral charts and we see three very negative charts, C, BAC and HSBC. These three banks have $105.7 trillion in notional values of derivatives, 45% of the entire total. In the two charts below, OBV stands for On Balance Volume, an indicator popularized by the late and great Joe Granville. Both HSBC and C display startling price weakness versus the major averages and OBV suggests the smart money has exited.
Consider how prices differ for the top ten banks from their price peaks of the previous mania beginning in 2006 (see table last column). Despite the bailouts and tremendous monetary accommodation, the average loss is still 32.4% for the group against a 25.3% gain for the S&P 500. Note: JPM is actually down 13.2% from its all time high in 2000 and has the largest derivative portfolio of all.
The five largest derivatives players of the top ten banks control 93.8% of total notional values. They are up an average of 4.9% year to date and are up 16.5% since 2013 as the rising tide has lifted almost all boats. In comparison, the second five largest derivatives players control only 4.3% of all notional values but are doing much better, up 7.7% year to date and a resounding 48.9% since 2013 arrived. These comparisons are simply too startling to ignore and imply the possibility of burgeoning systemic problems and/or lingering imbalances from the previous financial crisis. Given the procession of financial crises in 1987, 1998 and 2007, we believe our worries are well placed. As well, given the Federal Reserves policies since the financial crisis have benefited the banking industry to such a large extent, one is extremely hard pressed to excuse even the slightest bit of price weakness. The Fed routinely goes the extra mile and even advertises when their next bond buying binge will occur to allow the banks to position as profitably as possible. Why is the entire bank sector not surging to new highs every single day? There is no question the biggest banks were too big to fail in 2008 but they may have also been too big to succeed under an accommodation policy that still encourages risky exposures. Clearly, something is amiss.
ENROLL IN OUR FREE TRIAL. NO OBLIGATION.
WATCH THIS SPACE FOR MORE COMMENTARY ON AUGUST 1st.
WHY NOT REQUEST A FREE TRIAL?
Powerful Commentary. Unique Perspectives.
ABOUT ALAN M. NEWMAN
Alan M. Newman has been the Editor of CROSSCURRENTS since the first issue was published in May of 1990. Mr. Newman is also a member of the Market Technician's Association and has been widely quoted for years by the financial press, media, and other newsletters and has written articles for BARRON'S.
The newsletter is published once each month and focuses on economic and stock market commentary, often covering controversial subjects. Several proprietary technical indicators are usually featured in every issue accompanied by current interpretation. Broad samples of our work can be viewed at http://www.cross-currents.net/.
Subscription rates are now $169 for one year and $89 for six months. A FREE 3 issue trial subscription is available by emailing us (click the "free trial" link above). Please note: trial requests must include name, address and phone number and must originate from the email address the trial is to be delivered. Trials are only available by Email (.pdf files). U.S. Mail subscriptions are available but include a nominal surcharge for postage and handling.


