Jump to content


Photo

Precious Metals Update - 6/23/17

xau xauyahoo advance/decline precious metals a/d line gold inflation disinflation deflation

  • Please log in to reply
7 replies to this topic

#1 fib_1618

fib_1618

    Member

  • Traders-Talk User
  • 10,145 posts

Posted 25 June 2017 - 01:33 AM

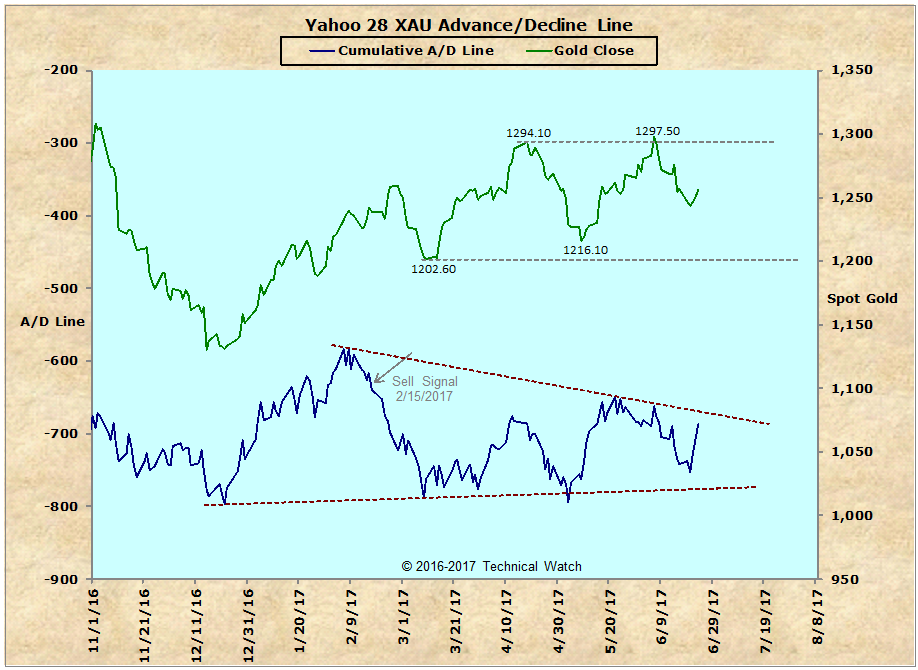
Though the May rally in the precious metals was constructive, we continued to see a lack of underlying internal trend support by the XAU/Yahoo advance/decline line, and with the price of silver failing to match the amplitude in the run up in gold, the best interpretation for now is that gold has morphed into a trading range between $1200 and $1300 an ounce.


This month's precious metals update shows that after the price of gold rallied to challenge the highs of April on June 6th, breadth of market in the precious metals stocks weakened again, and this has left us with the upper end of our expected trading range. However, with both the CRB and DBC commodity indexes continuing to decline sharply over the last couple of months, this is something that is becoming more and more worrisome toward any future inflationary expectations as even the trend of lower interest rates (cheaper money) has yet to help in providing enough monetary excesses to support the precious metals group as a whole. Taken together, this would strongly suggest that with the end of the Fed's Quantitative Easing policy that the asset classes are now showing a real need for another QE type fix, as the last traces of the drug leave the financial system, to keep things from collapsing altogether in what has now become a period of disinflation.


In any event, current conditions suggest that we should look for the trading range in gold to continue over the next couple of weeks with the still ongoing expectation of a tradable bottom for the metals still scheduled for the early part of August. That said, we also have to be acutely aware of the fact that the longer term gold chart shown earlier in another thread might also be indicating that a period of all out deflation might also be upon us which would lead to an all out collapse in this asset group along with everything else Dollar denominated (at least that's the theory). That is, of course, unless the Fed stops looking left (tightening) when it should be looking right (easing) and gives the markets what it desperately needs to "maintain" stability.


We'll see how it goes.


The next update will be on the weekend of July 28th....good trading.


Fib


xauyahoo062317.png


Better to ignore me than abhor me.

“Wise men don't need advice. Fools won't take it” - Benjamin Franklin


"Beware of false knowledge; it is more dangerous than ignorance" - George Bernard Shaw


Demagogue: A leader who makes use of popular prejudices, false claims and promises in order to gain power.

Technical Watch Subscriptions


#2 MDurkin

MDurkin

    Member

  • Traders-Talk User
  • 638 posts

Posted 25 June 2017 - 06:26 AM

Thanks Dave always good to here your thoughts...good trading to you .


#3 claire

claire

    Member

  • Traders-Talk User
  • 649 posts

Posted 25 June 2017 - 08:58 AM

Thanks for your updates Fib


#4 dougie

dougie

    Member

  • Traders-Talk User
  • 9,040 posts

Posted 25 June 2017 - 12:50 PM

Thanks as always.am I imaging a slight healthy divergence in your chart?

#5 senorBS

senorBS

    Member

  • TT Member+
  • 10,939 posts

Posted 25 June 2017 - 01:31 PM

what looks potentially interesting from that chart is the very recent strong snap back in the miners A/D line vs gold's very modest bounce, if bullish my guess is internals will now lead and you will see the miners move above the a/d downtrend line before decisively break out above recent highs - "if bullish"


Senor


#6 Russ

Russ

    Member

  • Traders-Talk User
  • 7,193 posts

Posted 26 June 2017 - 02:20 PM

While I appreciate your updates, viewers should also be aware that you issued a sell signal last Dec. right at the bottom (which you are not showing on your chart)  and missed the rally into Jan, whereas my signal was bullish then and is bullish now going into mid Aug.


Edited by Russ, 26 June 2017 - 02:22 PM.

"Nulla tenaci invia est via" - Latin for "For the tenacious, no road is impossible".
"In order to master the markets, you must first master yourself" ... JP Morgan
"Most people lose money because they cannot admit they are wrong"... Martin Armstrong


http://marketvisions.blogspot.com/

#7 fib_1618

fib_1618

    Member

  • Traders-Talk User
  • 10,145 posts

Posted 26 June 2017 - 03:14 PM

While I appreciate your updates, viewers should also be aware that you issued a sell signal last Dec. right at the bottom (which you are not showing on your chart)  and missed the rally into Jan, whereas my signal was bullish then and is bullish now going into mid Aug.


Well...I wasn't expecting an out of the blue pissing contest since all I do is post a chart, generally once of month, of which I "thought" people would find informative,and then give my best interpretation of that same chart.


So be it.


Now...although I didn't say outright that it we should expect to have our usual year end bottoming action, the series of posts linked below after the sell signal in the summer did imply it (note that two additional posts were made in December as we got closer to, what could had been, a bullish resolution). The reader will also note that I never gave a "sell signal" as you claim...only that bull divergence was broken and delaying the a buy point for 2/3 weeks.


I guess I wasn't good enough this time around...I'll try to do better in the future.


Anyway, I'm happy that you went out of your way to get this off your chest and wish you (and Armstrong) a very nice day.


Fib


July 30, 2016 - http://www.traders-t...pdate/?p=750083


August 28, 2017 - http://www.traders-t...pdate/?p=751272


October 2, 2016 - http://www.traders-t...pdate/?p=753007


October 30, 2017 - http://www.traders-t...pdate/?p=754498


November 27, 2016 - http://www.traders-t...pdate/?p=755949


December 10, 2016 - http://www.traders-t...t-out/?p=756890


December 10, 2016 (further evaluation) - http://www.traders-t...t-out/?p=756894


December 18, 2016 (possible delay until mid January) - http://www.traders-t...ering/?p=757476


January 29, 2017 - http://www.traders-t...pdate/?p=759179


Better to ignore me than abhor me.

“Wise men don't need advice. Fools won't take it” - Benjamin Franklin


"Beware of false knowledge; it is more dangerous than ignorance" - George Bernard Shaw


Demagogue: A leader who makes use of popular prejudices, false claims and promises in order to gain power.

Technical Watch Subscriptions


#8 Russ

Russ

    Member

  • Traders-Talk User
  • 7,193 posts

Posted 27 June 2017 - 01:05 AM

fib_1618, on 18 Dec 2016 - 10:17 AM, said:snapback.png

Yea, Yellen's suggestion that there would be 3 more interest rate increases in 2017 was just too much to "bear".


Now in a reset mode with no tradable low until mid to end January with a challenge of $1050 level likely.


A break of $1050 projects to a test of the 2008 lows at $700.

The low came in on Dec 15 @ $1124.30 , then on Dec 18 you wrote above that there was no tradable low until Mid to Late Jan, sure looked like a sell signal to me, it's ok I am not perfect either, nobody is. Armstrong is not my buddy btw but I think he is a great analyst.  I am seeing on my gold chart a strong trend for the final low in late 2017 which is in agreement with both your view and Mr. A's, I do think GDX etc will see a rally into August first, if I am wrong I will get stopped out and take my lumps.  Peace. 


"Nulla tenaci invia est via" - Latin for "For the tenacious, no road is impossible".
"In order to master the markets, you must first master yourself" ... JP Morgan
"Most people lose money because they cannot admit they are wrong"... Martin Armstrong


http://marketvisions.blogspot.com/


Also tagged with one or more of these keywords: xau, xauyahoo, advance/decline, precious metals, a/d line, gold, inflation, disinflation, deflation