Jump to content


Photo

THAT'S the ST LOW! SPX up 50 points from today's low


  • Please log in to reply
63 replies to this topic

#21 tradesurfer

tradesurfer

    Member

  • Traders-Talk User
  • 2,944 posts

Posted 27 October 2018 - 10:02 AM

I am not seeing any headlines about the stock market wild gyrations at the top of google news.  When we start to see big top fold headlines about the DJIA THEN you will know we are a day or two away from the bottom.


MEDIA INDICATOR is now bullish as the media screams about market decline, even using the C word....  Jane & John Doe now knows, the last to know.... at least for now.

BE ON ALERT for carefully chose "comments" from the FED, and influential people in the markets, that will generate a rally. 


#22 PrintFaster

PrintFaster

    Member

  • Traders-Talk User
  • 1,683 posts

Posted 27 October 2018 - 10:32 AM

The trend is still down


#23 dTraderB

dTraderB

    Member

  • Traders-Talk User
  • 17,088 posts

Posted 27 October 2018 - 05:24 PM

Now, I don't regard oversold or overbought  as usefu since I have seen - too may times and it has been carved in by brain- that markets can continue being oversold or overbought for weeks & months! But, I also don't disrgard  analysis of Mc Clennan!


Tom McClellan: NDX Stocks Showing the Oversold Condition
Tom McClellan |  October 25, 2018 at 12:36 PM


1540495803224243696614.gifThe bearish seasonality of July to October got put off until the last minute, and now the stock market has tried to do 4 months’ worth of work in just a couple of weeks. One result of that cramming at the last minute is that a pretty deep oversold condition has arisen, which is evident in a variety of indicators, including this week’s chart.


https://stockcharts....-condition.html


#24 dTraderB

dTraderB

    Member

  • Traders-Talk User
  • 17,088 posts

Posted 27 October 2018 - 05:27 PM

Divergence?


McClellanOsc_404.gif


NYSE: 10/26/2018   Issues   Volume(000s) Advances 831   1185761 Declines 2162   3512515 Difference -1331   -2326754 10% Trend -462 . 695 -700306 5% Trend -332 . 649 -430597 McC OSC -130 . 046 -269709 PRIOR McC OSC -86 . 112 -188790 SUMM Index -1156 . 076 -1878584 PRIOR SUMM Index -1026 . 31 -1608875 A-D for OSC UNCH -593   -970 * A-D for OSC=0 2008   4424 * *million shares   DJIA Close 24688.31 PRIOR Close 24984.55 DJIA CHG -296.24 DOW Price OSC -216.66 PRIOR DOW Price OSC -181.36 Price OSC UNCH'D

25270.27


https://www.mcoscill...t_breadth_data/


#25 dTraderB

dTraderB

    Member

  • Traders-Talk User
  • 17,088 posts

Posted 27 October 2018 - 05:31 PM

Who the heck waits to go short after a 10% drop that is then proclaimed as a CORRECTION!!

Then there is the BEAR MARKET afte 20% !

Aren't these archaic and useless? If you aren't short after 2 or 3 % then.... 

I would not wait on outlier events to trade, e.g. be short for months while waiting on a crash.... or buy and hold for years!

When Stocks Fell 10%…

Posted 

October 25, 2018  by Ben Carlson

As of the market’s close yesterday the S&P 500 was down 9.4%. Not quite a 10% correction but it’s a stone’s throw away.

The question all investors would like to know is how much further this downturn has to go.

The answer is I don’t know and neither does anyone else.

But we can look back historically to see how many corrections turned into bear markets or crashes to get a better sense of the potential range of outcomes.

Going back to 1928…

When stocks fell 10%:

  • 44.7% of the time they didn’t fall any further than 15%
  • 12.8% of the time they didn’t fall any further than 20%
  • 17.0% of the time they fell between 20% and 30%
  • 10.6% of the time they fell between 30% and 40%
  • 8.5% of the time they fell between 40% and 50%
  • 6.4% of the time they fell more than 50%

When stocks fell 15%:

  • 23.1% of the time they didn’t fall any further than 20%
  • 30.8% of the time they fell between 20% and 30%
  • 19.2% of the time they fell between 30% and 40%
  • 15.4% of the time they fell between 40% and 50%
  • 11.5% of the time they fell more than 50%

When stocks fell 20%:

  • 40.0% of the time they didn’t fall any further than 30%
  • 25.0% of the time they fell between 30% and 40%
  • 20.0% of the time they fell between 40% and 50%
  • 15.0% of the time they fell more than 50%

When stocks fell 30%:

  • 41.7% of the time they didn’t fall any further than 40%
  • 33.3% of the time they fell between 40% and 50%
  • 25.0% of the time they fell more than 50%

When stocks fell 40%:

  • 57.1% of the time they didn’t fall any further than 50%
  • 42.9% of the time they fell more than 50%

When stocks fell 50%:

  • 66.7% of the time they didn’t fall any further than 60%
  • 33.3% of the time they fell more than 60%

Here’s a chart showing the frequency of drawdowns by the different levels:

Capture-30.png

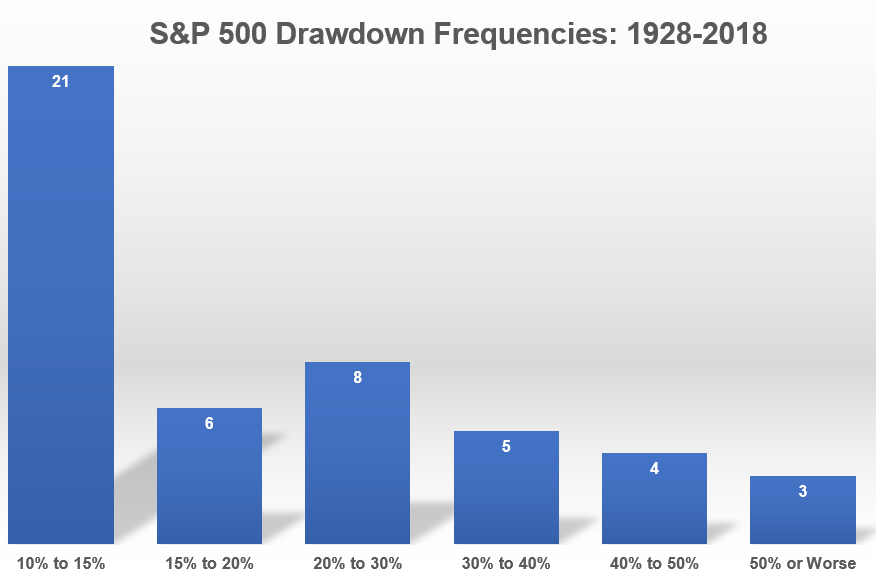
So roughly 60% of the time a 10% correction didn’t lead to a bear market while roughly 40% of the time it did. The further down you go on the loss spectrum the smaller the sample size but this gives you a good idea of how things have looked historically in terms of the loss profile of the stock market once they have already begun their descent.

The average correction which saw stocks drop 10% but not enter bear market territory1 was a drawdown of -14%, lasting 132 days from peak-to-trough. Bear markets in this time frame experienced a drawdown of -37% over 358 days, on average.2

Historical information like this can help put things into perspective but historical data is rarely enough to help people sleep at night or change their behavior. Market averages tell a story but no one’s experience in the markets is ever average in the moment.

The past is easy because we know what happened but the future is messy since the uncertainty of the potential outcomes cannot be reduced.

Most of the time the stock market has a run-of-the-mill correction that doesn’t turn into a bear market but a bear market is always a possibility. And every time stocks begin to fall there’s a little voice in the back of our heads that tell us, “Maybe this is the big one…”

Intelligent investors bake these scenarios into their investment plan and prepare for them in advance. No matter the path stocks take from here, if you don’t have a plan in place about how to react no matter the outcome, now would be a good time to formulate one.

Even a bad plan is better than no plan at all.

Further Reading:
To Win You Have to Be Willing to Lose

1Using 20% as our magical threshold for a bear market.

2The Great Depression skews things a little here but the numbers are what they are. Since WWII, the average bear market was a drop of 33% over 395 days, on average.

https://awealthofcom...stocks-fell-10/


#26 dTraderB

dTraderB

    Member

  • Traders-Talk User
  • 17,088 posts

Posted 28 October 2018 - 07:36 AM

48084227_15406635645489_rId12.png


Greed maxed out around November 2017, but the S&P went on to accrue perhaps another 10% or so before reversing. I think that’s pretty reasonable to where we are now. Put differently, I do not believe that this fear reading is much akin to that of early 2016 or Q1 2018.

We may get a rest and/or a bounce, but I just don’t see how it sticks.


#27 dTraderB

dTraderB

    Member

  • Traders-Talk User
  • 17,088 posts

Posted 28 October 2018 - 07:38 AM


48084227_15406635645489_rId10.png

The bull market of the last decade has caused many to shift over to a buy-the-dip mantra. As humans we suffer from recency bias: whatever has happened recently receives more weight in terms of how we assess the current environment.

I am very open to the idea that we are not done with this spill. We simply do not have the support at the institutional level that we received in the last few major instances where we blew out (June ’13, Oct ’14, Sep ’15, Feb ’16, June ’16). In every single one of the cases I just listed, markets only recovered because they were revived by policymakers.

I am not saying that we have to continue dropping and swinging to and fro. But I am asserting that there is every good reason to believe that this spate of tremors will not neatly revive itself in the way that it has done in recent past instances.

48084227_15406635645489_rId11.png

…Mixed bag here. Some of the earnings have come in quite well: just remember the rally on Thursday that was largely credited to Tesla (NASDAQ:TSLA) and Microsoft (NASDAQ:MSFT). On the other hand, Friday morning’s sell-off was quite likely attributable at least in part to Amazon (AMZN) and Google (GOOG) (NASDAQ:GOOGL) and their failure to meet lofty investor expectations.


#28 dTraderB

dTraderB

    Member

  • Traders-Talk User
  • 17,088 posts

Posted 28 October 2018 - 07:39 AM

Andrew Zatlin at Moneyball Economics says two of the three engines of global economic growth are stalling with China, in particular, showing signs of panic borrowing.

China Faltering

While China has been the greatest contributor to global economic growth in recent decades, Zatlin says it is essentially a house of cards built on a massive amount of debt.

"China's rising debt levels across all areas of its economy are seen as a major risk to global growth, with some analysts estimating that the next financial crisis could crystalize from the world's second largest economy," Business Insider wrote last week.

Contrary to popular opinion, Zatlin noted, this slowdown hasn't been driven by the trade war with the U.S. While the trade war doesn't help, the fundamental driver is massive debt.

"The Chinese are trying to figure out how to navigate a slowdown," he said. "Things are now in a panic situation… They're going to put everything aside and say, 'We don't care anymore. Just get this stuff back up. Let's re-inflate and do whatever we can.'"

saupload_china-germany-us-pmi_thumb1.png
Source: Bloomberg, Financial Sense Wealth Management

Europe's Screaming for a Trade Deal

In Europe, especially Germany, we're seeing another slowdown. Europe has been engaged in a massive level of fiscal spending for the last three years.

Near $100 billion was spent in 2017 to integrate the migrants that came into Europe. That's a substantial amount to throw into the economy, Zatlin noted, and of course it has driven GDP higher as a result. But this effect is fading now.

What we're currently seeing in Europe is reversion to the mean. If we strip out the influx of capital that's come in from the public purse in Europe, the continent probably has a negative GDP.


"The number of widgets going in and out of Europe is less than it was last year," Zatlin said, "and that's again the trend before Trump came out with the tariff war."


#29 CLK

CLK

    Member

  • Traders-Talk User
  • 10,787 posts

Posted 28 October 2018 - 07:41 AM

Everybody wants to see the market drop big for quick money, but bear markets aren't nearly as easy to trade as bull markets.


#30 dTraderB

dTraderB

    Member

  • Traders-Talk User
  • 17,088 posts

Posted 28 October 2018 - 07:45 AM

a Bounce, then a drop to test 2018 lows, then midterms....

Do not be surprised if the market behaves just as it did on the night of the 2016 elections and then for almost 18 months afterwards:

a big initial dip then up & away. 


Is The October Selloff Really 'The Big One'?

As ever, you can take all of the above for what it's worth, but in the final analysis, it's hard to imagine that this is "the big one" (so to speak), until we see a sustained and synchronized move in cross-asset volatility and marked signs of acute stress in credit.

I'll leave you with another quote from Nomura's McElligott (all-caps, punctuation, etc., is verbatim from the original):

The next week is “make or break” on the rest of the year SPX “rally” trade, ESPECIALLY after what should be [Friday's] potential CAPITULATION in Equities “Growth”—positioning has been RINSED; majority of the buyback resumes; seasonality and mid-term “bullish” analogs “kick-in”; and VIX curve inversion “bull signal” should GO all against more CRITICAL data in the form of CPI to get the positive growth-and inflation- related move higher in yields resuming.

https://seekingalpha...lly-the-big-one