Jump to content


Photo

ST & IT bullish - SPX hourly approaching SELL signal


  • Please log in to reply
19 replies to this topic

#1 dTraderB

dTraderB

    Member

  • Traders-Talk User
  • 17,166 posts

Posted 07 January 2019 - 07:37 PM

Stock Market Update 16:20 ET Dow +98.19 at 23531.35, Nasdaq +84.61 at 6823.48, S&P +17.75 at 2549.65 :

[BRIEFING.COM] The S&P 500 gained 0.7% on Monday, securing its fourth day of gains in the last five sessions. The Dow Jones Industrial Average gained 0.4%, the Nasdaq Composite gained 1.3%, and the Russell 2000 outperformed with a gain of 1.8%.


Looking ahead, investors will receive the NFIB Small Business Optimism Index for December, the JOLTS - Job Openings and Labor Turnover report for November, and Consumer Credit for November on Tuesday.

  • Russell 2000 +4.2% YTD
  • Nasdaq Composite +2.8% YTD
  • S&P 500 +1.7% YTD
  • Dow Jones Industrial Average +0.9% YTD

..NYSE Adv/Dec 2348/619. ..NASDAQ Adv/Dec 2303/746.


ST & IT still LONG but SPX hourly can reverse to SHORT @ 2532

Market could not hold the early gains 


SentimenTraderVerified account @sentimentrader
FollowFollow @sentimentrader
More

This is only the 2nd time the ratio-adjusted McClellan Oscillator went from < -95 to > +95 in 2 wks. The other was November 7, 1962.


There were 3 times it went from -80 to +80 (November ’62, Jun ’70 and Mar ’09). A year later, the S&P 500 was +25%, +28%, and +50%, respectively.

3:16 PM - 7 Jan 2019


#2 dTraderB

dTraderB

    Member

  • Traders-Talk User
  • 17,166 posts

Posted 07 January 2019 - 07:40 PM

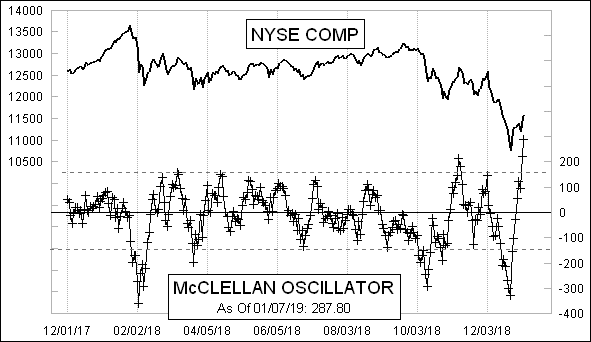
Look a this!


McClellanOsc_451.gif


soaring to levels not see last year!


https://www.mcoscill...t_breadth_data/


#3 dTraderB

dTraderB

    Member

  • Traders-Talk User
  • 17,166 posts

Posted 07 January 2019 - 07:44 PM

Helene Meisler Retweeted Liz Ann Sonders

Breadth thrusts

Helene Meisler added,

Liz Ann SondersVerified account @LizAnnSonders
Replying to @hmeisler @erwillia
Two breadth thrusts over past couple of weeks (> 95% of volume on NYSE in advancing stocks)...among best thrusts in 60y...only other similar eras were August 1982, January 1987, and a couple during August–November 2011...strong returns in subsequent 6m
5 replies1 retweet18 likes
Reply
 5
 
Retweet
 1
 
 
Like
 18


#4 dTraderB

dTraderB

    Member

  • Traders-Talk User
  • 17,166 posts

Posted 07 January 2019 - 07:52 PM

Sven HenrichVerified account @NorthmanTrader
FollowFollow @NorthmanTrader
More

Sven Henrich Retweeted CNBC Now

Another one bites the dust

Sven Henrich added,

CNBC NowVerified account @CNBCnow
BREAKING: Samsung sharply cuts Q4 earnings guidance, says results will be far below market expectations due to weakness in memory and increasing smartphone market competition https://www. cnbc.com/2019/01/08/samsung-q4-guidance-.html 
4:25 PM - 7 Jan 2019


#5 dTraderB

dTraderB

    Member

  • Traders-Talk User
  • 17,166 posts

Posted 07 January 2019 - 07:56 PM

Michael Santoli Retweeted Michael Santoli

The S&P 500 is up more than 200 points from its intraday low set the trading day *after* this, from Friday, Dec. 21. And the index is up about 120 points since the call went out. So it was one day and a brutal 80 points "early" - but not wrong.

Michael Santoli added,

Michael SantoliVerified account @michaelsantoli
Short-term tactical call just now from the #MysteryBroker: "The stock market is going to rally 150 to 200 S&P 500 points starting either today or Monday. My technical indicators are short-term at levels that always cause a vicious rally. The shorts are going to be covering."
17 replies7 retweets84 likes
Reply
 17
 
Retweet
 7
 
 
Like
 84


#6 dTraderB

dTraderB

    Member

  • Traders-Talk User
  • 17,166 posts

Posted 07 January 2019 - 07:59 PM

Jesse ColomboVerified account @TheBubbleBubble
FollowFollow @TheBubbleBubble
More

The S&P 500 is testing that 2,550 to 2,600 resistance zone. It means nothing unless it can close above that zone in a decisive manner on the weekly chart. Learn more: https://realinvestmentadvice.com/the-market-is-still-in-a-confirmed-downtrend/  $SPY $SPX

DwVLK0CV4AA45Xj.jpg
11:13 AM - 7 Jan 2019


#7 dTraderB

dTraderB

    Member

  • Traders-Talk User
  • 17,166 posts

Posted 07 January 2019 - 08:05 PM

Investors, prepare for a fake-out rally in the stock market

https://www.marketwa...rket-2019-01-07


#8 dTraderB

dTraderB

    Member

  • Traders-Talk User
  • 17,166 posts

Posted 08 January 2019 - 10:15 AM

Bulls stormed through the easy terrain but from here on it is the heavy lifting zone. Not saying 

the rally is over but it requires more conviction and courage for bulls to take this above SPX 2600


My SPX hourly "where we are" chart, as of close yesterday

Resistance at 200ma (blue line) just above 2600

Resistance at that dotted line at about 2580 (today's high. so far)

Support at my NO-BS magenta line 

Support at the 20ma 2514 (yellow)

Support at the 50ma 2491 (cyan)


Note this is not a MA crossover "system"

Most of the time I would have opened one or more daytrades and closed them before any crossover, up or down.


spxhj7.png


#9 12SPX

12SPX

    Member

  • Traders-Talk User
  • 12,463 posts

Posted 08 January 2019 - 10:23 AM

Nice chart thanks!!


#10 dTraderB

dTraderB

    Member

  • Traders-Talk User
  • 17,166 posts

Posted 08 January 2019 - 10:35 AM

Watch that VIX and VXX divergence as market gives up most of the overnight rally.


VIX UP - yesterday & today, relatively