Jump to content


Photo

ST & IT still LONG, nearing top


  • Please log in to reply
9 replies to this topic

#1 dTraderB

dTraderB

    Member

  • Traders-Talk User
  • 17,167 posts

Posted 04 February 2019 - 07:34 PM

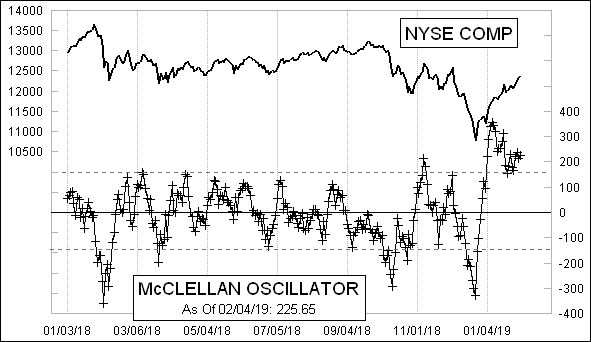
Classic BULL market UP day: pullback early, then gradual up moves with pull-backs, until final closing rally. 


SPX closed over the 2710/14 resistance and is ready to challenge the 200ma @ 2741.


Both IT & ST are long but the topping process in now underway with SPX 2760 targeted as max level in this V-shaped rally since December 24 last year. 


51469774_529751087536083_135485898269025


#2 dTraderB

dTraderB

    Member

  • Traders-Talk User
  • 17,167 posts

Posted 04 February 2019 - 07:35 PM

S&P 500 Now Projected to Report a Year-over-Year Decline in Earnings in Q1 2019


S&P 500 Now Projected to Report a Year-over-Year Decline in Earnings in Q1 2019

By John Butters, Feb 4, 2019


During the month of January, analysts lowered earnings estimates for companies in the S&P 500 for the first quarter. The Q1 bottom-up EPS estimate (which is an aggregation of the median EPS estimates for all the companies in the index) dropped by 4.1% (to $38.55 from $40.21) during this period. How significant is a 4.1% decline in the bottom-up EPS estimate during the first month of a quarter? How does this decrease compare to recent quarters?

https://insight.fact...ings-in-q1-2019


#3 dTraderB

dTraderB

    Member

  • Traders-Talk User
  • 17,167 posts

Posted 04 February 2019 - 07:44 PM

OddStats @OddStats
FollowFollow @OddStats
More

OH, HELLO BULLS 17 of the first 23 $SPX trading days of 2019 have been positive. That (or better) hasn't happened since 1976. Want to know how every year did (since 1923) with at least 17 positive days out of the first 23? Sorry, bears.

Dyl4EV2VsAAsqb6.jpg
1:33 PM - 4 Feb 2019


#4 dTraderB

dTraderB

    Member

  • Traders-Talk User
  • 17,167 posts

Posted 04 February 2019 - 07:46 PM

OddStats @OddStats
FollowFollow @OddStats
More

The S&P 500 is now up at least +16% in the last 30 trading days (from an intraday low). That HAS to be bullish for $SPX, right? Not necessarily. A lot of times it certainly is. Some times, it's just a big ol' bull trap.

DymBbibUcAACJ84.jpg
2:13 PM - 4 Feb 2019


#5 dTraderB

dTraderB

    Member

  • Traders-Talk User
  • 17,167 posts

Posted 04 February 2019 - 07:50 PM

David Rosenberg @EconguyRosie
FollowFollow @EconguyRosie
More

The worst December since 1931 followed by the best January since 1987. One should know that the Dec. 1931 setback was followed by a brief but sharp 20% bounce. And as for Jan. 1987, the only month people remember from that year was October.

DymPRyyVsAApCkO.jpg
3:13 PM - 4 Feb 2019


#6 dTraderB

dTraderB

    Member

  • Traders-Talk User
  • 17,167 posts

Posted 04 February 2019 - 07:54 PM

McC Osc Divergence, yeah, but that SUMMATION INDEX is powering ahead! 


McClellanOsc_471.gif

https://www.mcoscill...t_breadth_data/


#7 dTraderB

dTraderB

    Member

  • Traders-Talk User
  • 17,167 posts

Posted 04 February 2019 - 07:56 PM

Greedier! 


https://money.cnn.co...fear-and-greed/


This week’s NAAIM Exposure Index number is:
76.33

Last Quarter Average
53.76

http://www.naaim.org...exposure-index/


Edited by dTraderB, 04 February 2019 - 07:57 PM.


#8 redfoliage2

redfoliage2

    Member

  • Traders-Talk User
  • 18,000 posts

Posted 05 February 2019 - 02:17 PM

The market holding up and waiting for the Trump's speech late afternoon.  Let's see what he will say ...............


#9 redfoliage2

redfoliage2

    Member

  • Traders-Talk User
  • 18,000 posts

Posted 05 February 2019 - 03:43 PM

It's the same bots that pushed the market down last qtr and now they are pushing the market up .  What a casino.  If these bullish bots unable to push the market above SPX 2740 tomorrow it's may be the time for them to switch their algos..................


Edited by redfoliage2, 05 February 2019 - 03:51 PM.


#10 AChartist

AChartist

    Tim

  • Traders-Talk User
  • 5,800 posts

Posted 10 February 2019 - 12:48 PM

it could be 12 weeks up in my weekly basis with a pullback between,


yet a DOW quarterly low in next 3 months following that high.. I would take some off will sell in May


if that is working and setup again about late June. And that could be the last trading I do for quite a while


just long thereafter several years. I am putting most of 401k additions in cash will be the loose change in


June if I dont do the rest well.


"marxism-lennonism-communism always fails and never worked, because I know

some of them, and they don't work"  M.Jordan