Jump to content


Photo

The Anatomy of My Forecast Work


  • Please log in to reply
4 replies to this topic

#1 tsharp

tsharp

    Member

  • Traders-Talk User
  • 1,487 posts

Posted 04 May 2019 - 11:53 AM

In my nearly 25-years of being a student and trader in the financial and commodities markets, one of the most important lessons I ever learned has been to NOT be married to my forecast or opinion of what the market should do next...

My forecast from 4.9.16 had to be revised last December, when the SPX dropped much farther than I'd forecast, so it could reset its momentum indicator line long-term trend line and extend this bull market beyond the 2021 time frame I was originally looking for...


SPX-W-EW-4-9-16-Alt.jpg


SPX-W-4-5-19-Actual-1.jpg


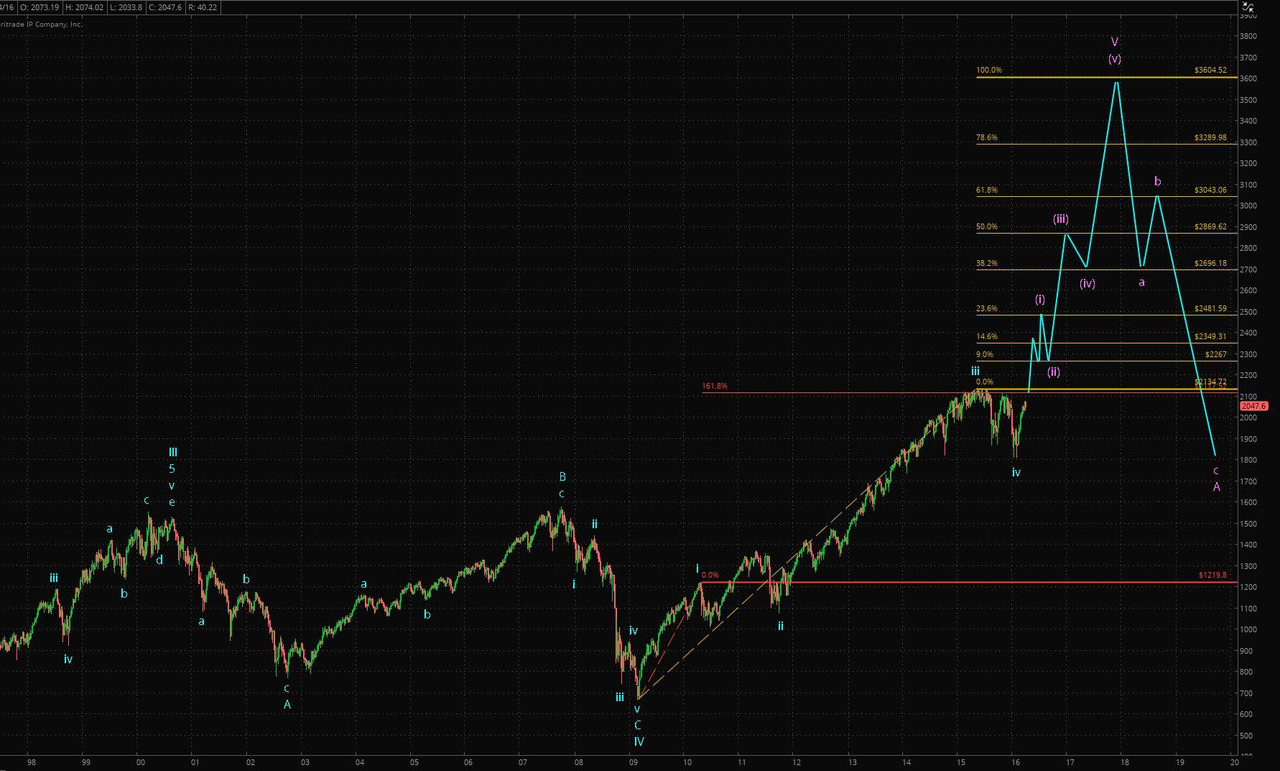
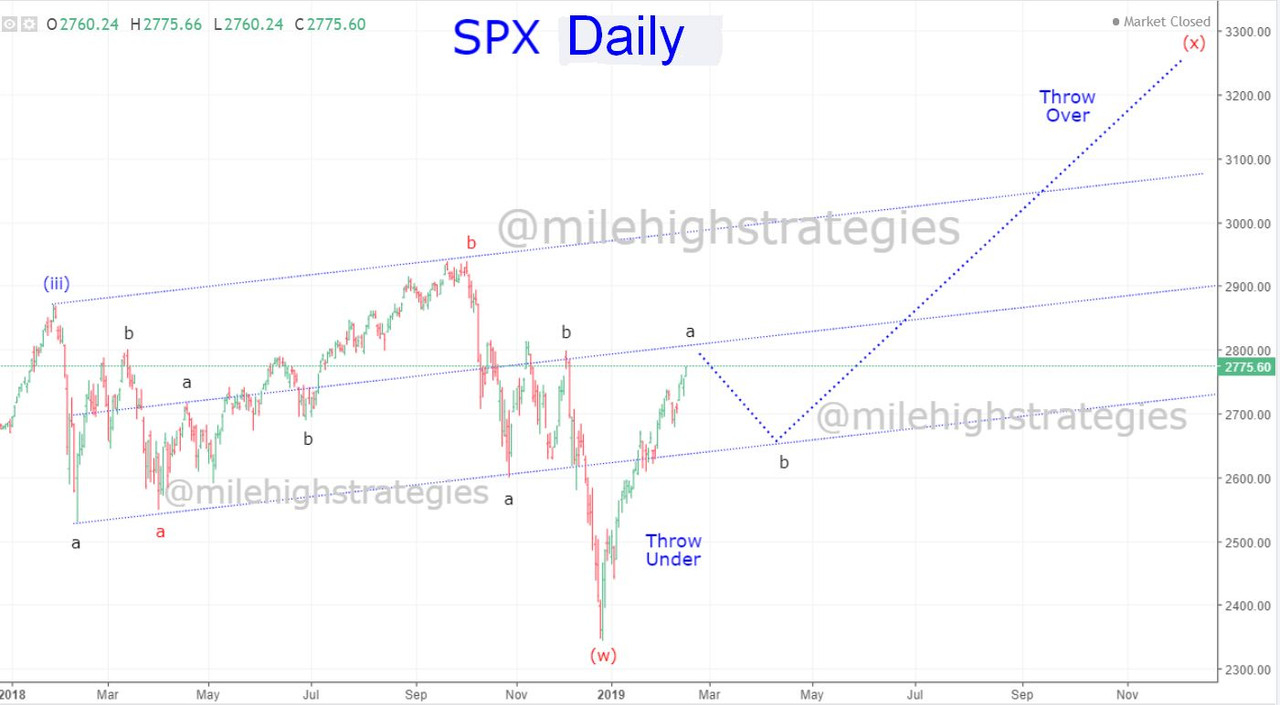
Since then, I forecast the SPX on 1.4.19 to go to new ATHs in months, rather than years (if at all) as so many of the pundits in this game were calling for...


SPX-D-1-4-19-1.jpg


Then on 2.15.19, I revised that forecast, calling for the wave-(x):(iv) high to push upward to the ~3290 range, rather than the ~3040 range, as my 1.4.19 forecast said...


SPX-D-2-15-19.jpg


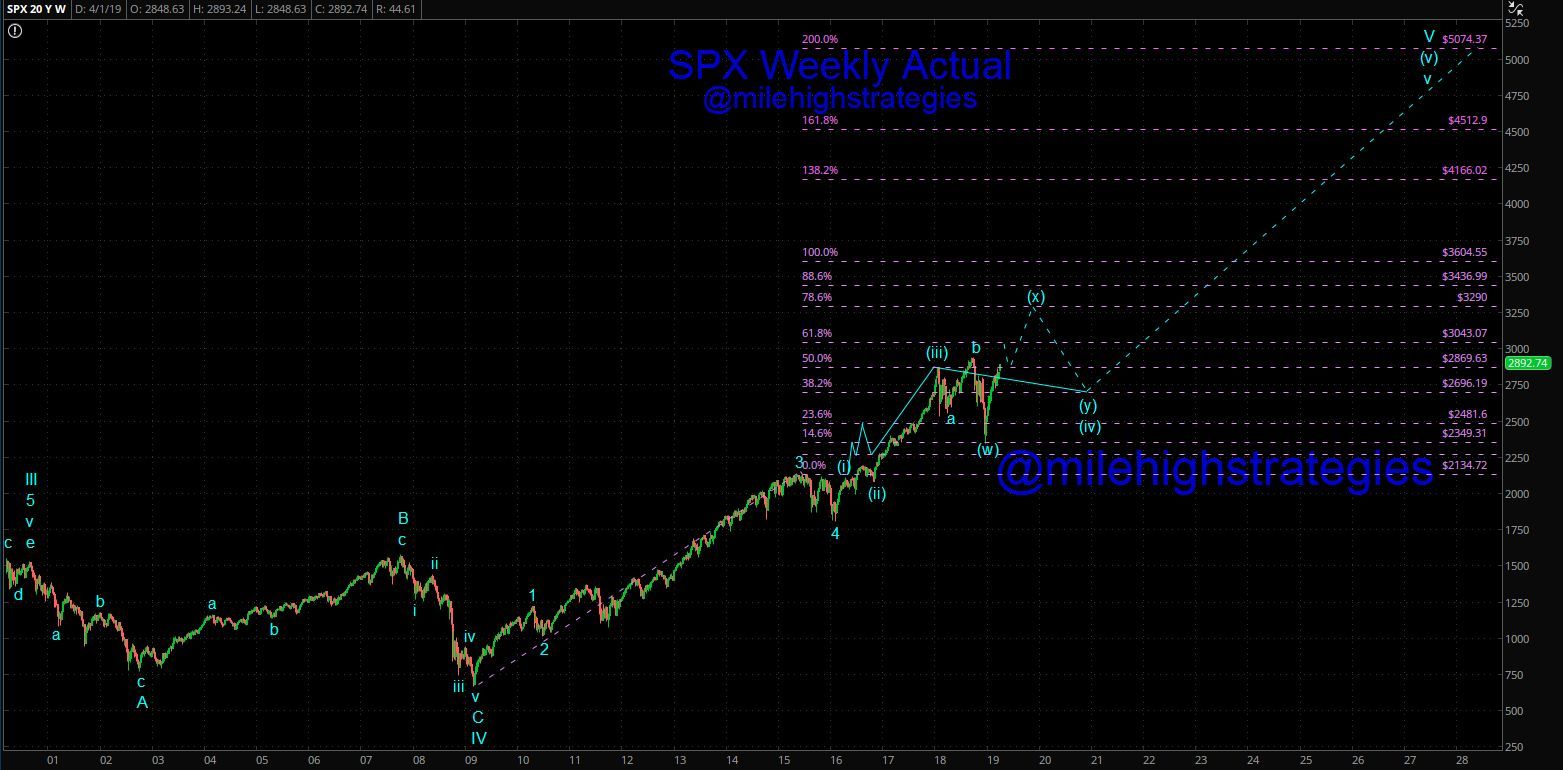
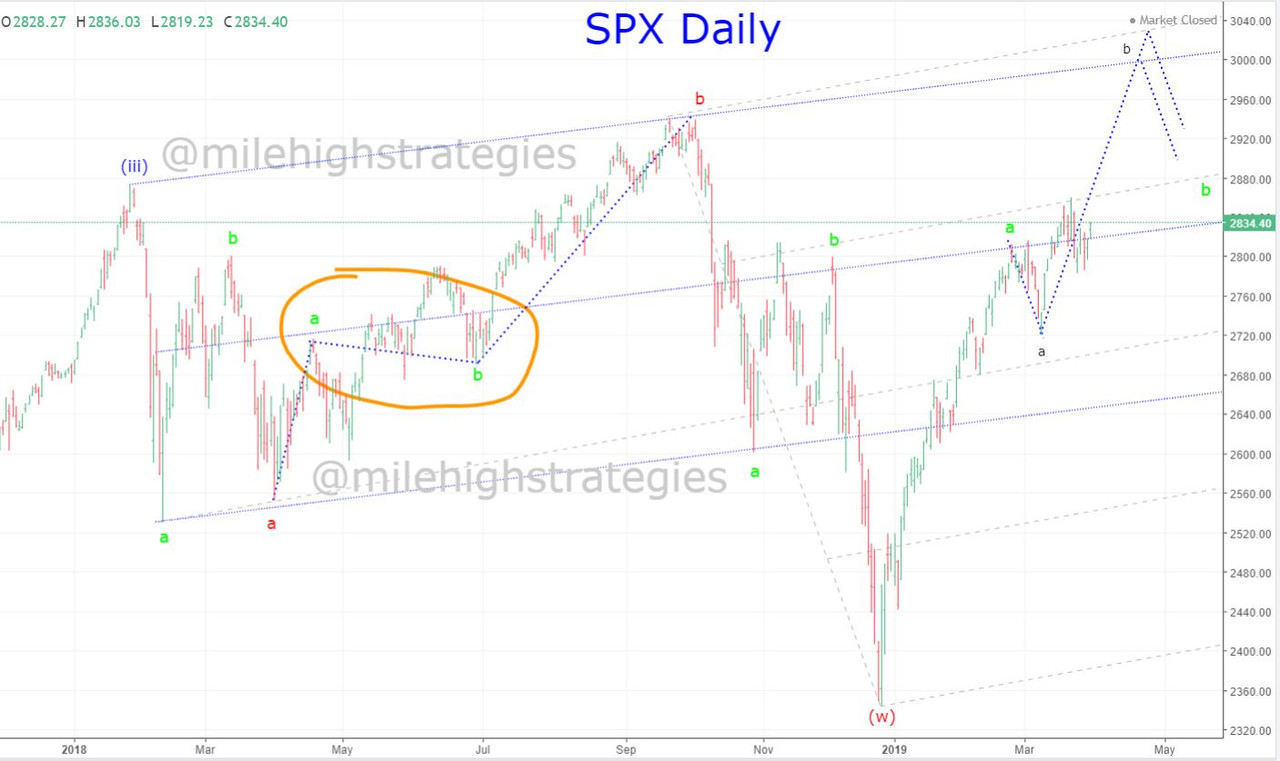
The next iteration of my forecast was on 3.29.19, when it became clear to me that the b-wave was going to be of the running variety, so the ~3040 price range came back into focus, but only as an interim high...


SPX-D-3-29-19-Alt.jpg


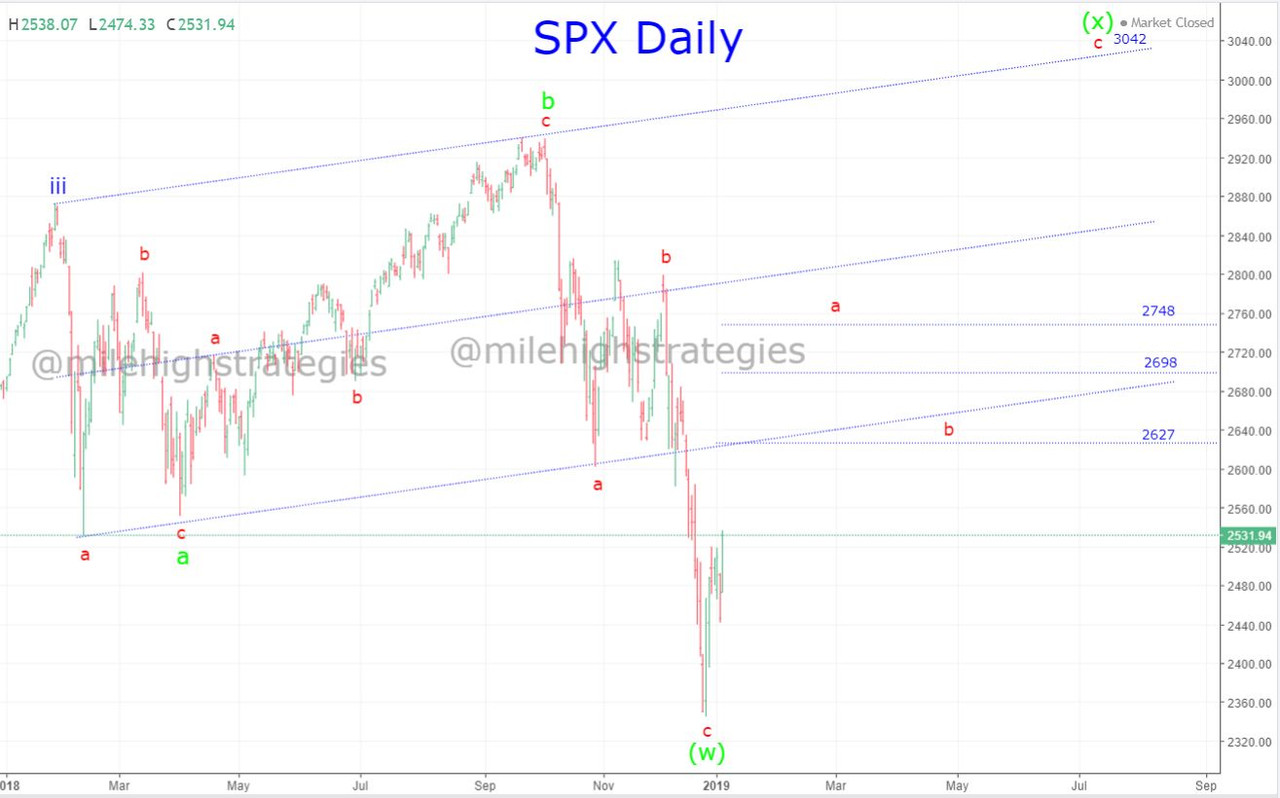
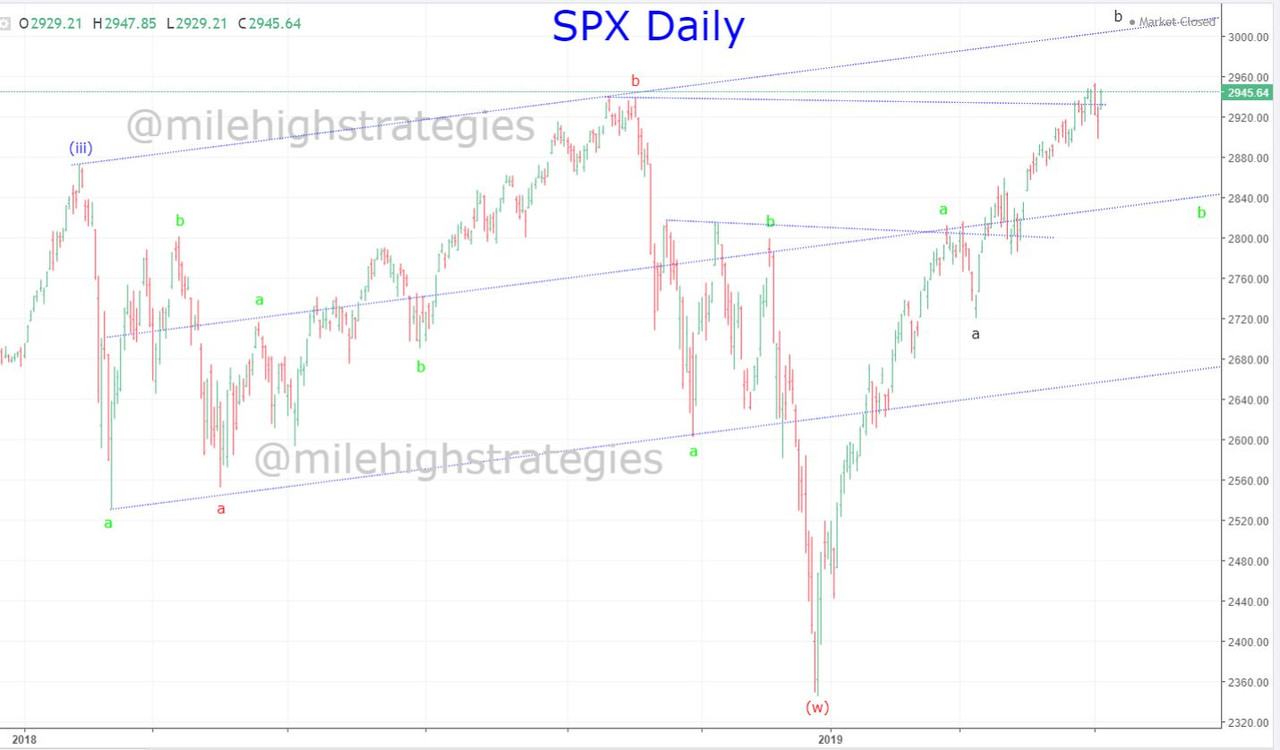
This last chart is from yesterday's close, showing the SPX is closing in on that ~3040 target, or the top channel line UTL... it's now within spitting distance...


SPX-D-5-3-19.jpg


The point here is to not be married to what you think the market should do, which is at best, an educated GUESS, but learn to be fluid, and flow with the market, as it's ALWAYS right... watching.


#2 CLK

CLK

    Member

  • Traders-Talk User
  • 10,787 posts

Posted 04 May 2019 - 06:42 PM

I'm really hoping we hit 3300 by end of June.


#3 tsharp

tsharp

    Member

  • Traders-Talk User
  • 1,487 posts

Posted 05 May 2019 - 08:12 AM

I really think with the Presidential election cycle, that the push upward into wave-(x):(iv) pushes out to nearer the end of the year... twt.


#4 CLK

CLK

    Member

  • Traders-Talk User
  • 10,787 posts

Posted 05 May 2019 - 10:47 AM

I really think with the Presidential election cycle, that the push upward into wave-(x):(iv) pushes out to nearer the end of the year... twt.


http://www.marketora...ticle63305.html


In the 3rd year presidential cycle, from the date of the midterm elections, the market has on average been up 15%, 25% in most bullish case 6-9 months out. So if you take the average Nov. 5th week price of 2750 and add 15% to that it equals 3162, add 25% and you get 3437. Also, the midterms mark a low into a 3 year bull run until the next 4yr cycle low due the 2nd year of the next term.  I didn't include any low % outliers because that would indicate an impending bear market which is highly unlikely after the recent rare breadth momentum signal of the summation index in Feb. 


My counts are probably invalid, but here is my best guess, weekly needs to get above the red uptrend line to hit 3300 by end of June.


https://invst.ly/aperj


Edited by CLK, 05 May 2019 - 10:52 AM.


#5 tsharp

tsharp

    Member

  • Traders-Talk User
  • 1,487 posts

Posted 05 May 2019 - 11:54 AM


I really think with the Presidential election cycle, that the push upward into wave-(x):(iv) pushes out to nearer the end of the year... twt.


http://www.marketora...ticle63305.html


In the 3rd year presidential cycle, from the date of the midterm elections, the market has on average been up 15%, 25% in most bullish case 6-9 months out. So if you take the average Nov. 5th week price of 2750 and add 15% to that it equals 3162, add 25% and you get 3437. Also, the midterms mark a low into a 3 year bull run until the next 4yr cycle low due the 2nd year of the next term.  I didn't include any low % outliers because that would indicate an impending bear market which is highly unlikely after the recent rare breadth momentum signal of the summation index in Feb. 


My counts are probably invalid, but here is my best guess, weekly needs to get above the red uptrend line to hit 3300 by end of June.


https://invst.ly/aperj


Sure, and there are other mitigating factors, such as the McO reading from January that has seen the SPX up between +25% - +50% one year later... I respect your stat, though considered it with this one also... AND the US economy is in great shape, which will draw only more foreign capital migration here... as Da Chief has been pointing out, many US fund managers are still on the sidelines; IMHO US capital is not very active here in this rise to date.


Mc-Clellan-1-7-19.jpg