Many of the analysts I follow think this is a mere pullback and the trend up resumes to new highs, Quite possible.
"New all-time highs – as projected – were the only possible way to reconcile those indicators.
Even though the S&P has reached the minimum requirement before a larger (and quite possibly nasty) pullback, the yellow projection carries the S&P 500 to trend line resistance around 3,000.
My preferred scenario was featured in the May 1 Profit Radar Report (see below). Based on this scenario, the S&P would drop to 2,890 – 2,865 (in wave 4) and rally towards 3,000 (in wave 5)."
image: http://www.ispyetf.c...es/SPX 5719.png
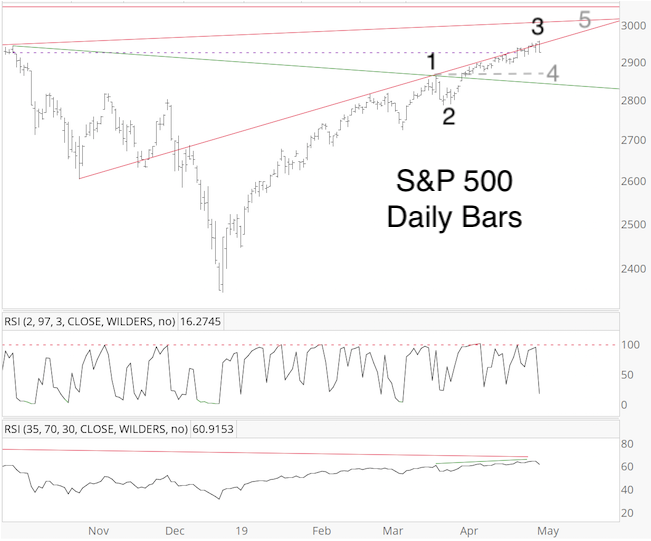
"Why is this my preferred scenario? Because waves 4 (especially when comparatively long-winded) tend to drag down high breadth and momentum readings (seen at wave 3 highs), which creates the bearish divergences usually seen at the wave 5 top (although the upcoming top should be noteworthy, I don’t expect this to be a major market top).
There was a bearish RSI divergence at the April 30 closing high, which could be enough for a sizeable drop, but a more pronounced set of divergences at higher prices would be a clearer signal.
Summary
The expected down side risk became reality, and the S&P may continue lower, but the 2,890 – 2,865 zone is where a rally to about 3,000 may start."
https://www.ispyetf.com
Read more at https://www.ispyetf....53SL4xSRBSHg.99