Jump to content


Photo

RALLY continues ... but watch that VIX


  • Please log in to reply
37 replies to this topic

#11 dTraderB

dTraderB

    Member

  • Traders-Talk User
  • 17,341 posts

Posted 08 June 2019 - 08:08 AM

Good one from Lance:


"However, while there was nothing "new" in that comment, it was his following statement that sent "shorts"scrambling to cover.


"In short, the proximity of interest rates to the ELB has become the preeminent monetary policy challenge of our time, tainting all manner of issues with ELB risk and imbuing many old challenges with greater significance.

"Perhaps it is time to retire the term 'unconventional' when referring to tools that were used in the crisis. We know that tools like these are likely to be needed in some form in future ELB spells, which we hope will be rare."

As Zerohedge noted:

"To translate that statement, not only is the Fed ready to cut rates, but it may take 'unconventional' tools during the next recession, i.e., NIRP and even more QE."

This is a very interesting statement considering that these tools, which were indeed unconventional"emergency" measures at the time, have now become standard operating procedure for the Fed.

Yet, these "policy tools" are still untested.

Clearly, QE worked well in lifting asset prices, but not so much for the economy. In other words, QE was ultimately a massive "wealth transfer" from the middle class to the rich which has created one of the greatest wealth gaps in the history of the U.S., not to mention an asset bubble of historic proportions."


#12 dTraderB

dTraderB

    Member

  • Traders-Talk User
  • 17,341 posts

Posted 08 June 2019 - 08:19 AM

Carl's VOLUME ratio tool


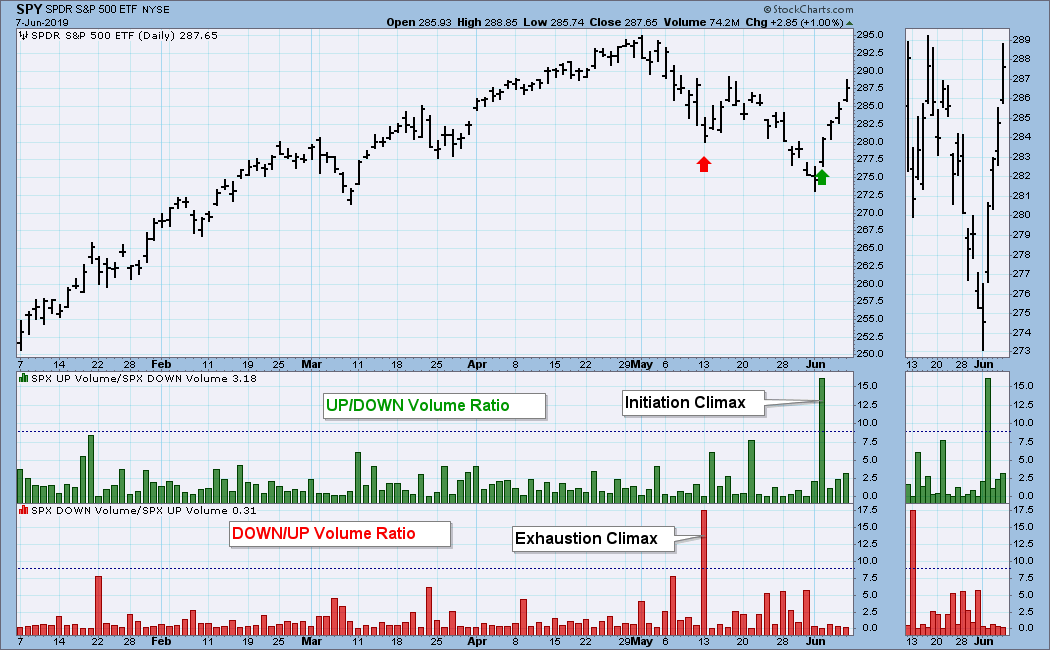
ome time ago on StockCharts TV I discussed volume ratios and how higher than normal ratios help identify climactic events and possible turning points. This week on Tuesday we had such an event when the  SPX up volume divided by down volume produced a ratio of over 15. I have identified it as an initiation climax because price action on that day broke a down trend and initiated a move to the upside. On the chart below in May we can also see a down volume divided by up volume ratio of over 17, which I tagged as an exhaustion climax --  price reversed the next day. However, as often happens with downside exhaustion climaxes, the exhaustion was only momentary, resulting in only a small bounce before the decline resumed. The question, which we will address below, is whether the current rally will persist.

1559941978087995416576.png

https://stockcharts....rket-turns.html


#13 dTraderB

dTraderB

    Member

  • Traders-Talk User
  • 17,341 posts

Posted 08 June 2019 - 08:24 AM

a skeptic, agree with some of this, especially the point that the FED should not be in a hurry to cut rates ....and may NOT cut rates, for months!


"Will the Fed take the bait? I’m a skeptic. Central bankers don’t like big dramatic moves, and Chairman Jay Powell is a cautious guy. Without much data indicating that a rate cut is needed, I don’t see the Fed making a move. Just because the market is getting the shakes doesn’t mean the Fed’s going to change course. In the Fed’s mind, they already placated Wall Street by calling off the rate hikes. But now Wall Street wants rate cuts? I doubt it.

I’m in the minority here, but Wall Street is getting way ahead of itself. I’ll give you an example. Recently, Chairman Powell made some perfectly anodyne remarks about the Fed being ready to “act as appropriate to sustain the expansion.” Big deal. All Fed officials say stuff like that. But Wall Street completely overreacted, and interpreted the remark as meaning the Fed is ready to pivot. That was enough to spark a relief rally this week.

That leads me back to our original metaphor. The financial markets (the dog on the leash) are frightened that we’re headed to recession. Meaning, the actual economy (the lady walking the dog) has shown very few signs of trouble.

Sure, this week’s ISM Manufacturing report came in a little light, but it wasn’t that bad. Some other data have been soft, but consumer confidence remains high. The jobless claims reports have been pretty good. Also, mortgage rates are down, so that will help the housing sector. But listening to the financial markets, you’d think the economy is plunging into the abyss.

Not only that, but it’s the kinds of stocks that have taken a beating that’s interesting. The pain has mostly been felt among more aggressive, cyclical stocks. For example, tech stocks have been down. Also, energy stocks are lagging badly. The small-cap Russell 2000 has fallen way behind."


https://www.crossingwallstreet.com/


#14 dTraderB

dTraderB

    Member

  • Traders-Talk User
  • 17,341 posts

Posted 08 June 2019 - 08:26 AM

OddStats @OddStats
FollowFollow @OddStats
More

This week, $SPX was up at least +4.5% from Monday's close through Friday's close, which MUST be bullish, right? Not according to this data from the last 20 years. $SPX was negative the next day almost 70% of the time.

D8fky4VU0AAryLK.png
3:48 PM - 7 Jun 2019


#15 dTraderB

dTraderB

    Member

  • Traders-Talk User
  • 17,341 posts

Posted 08 June 2019 - 08:29 AM

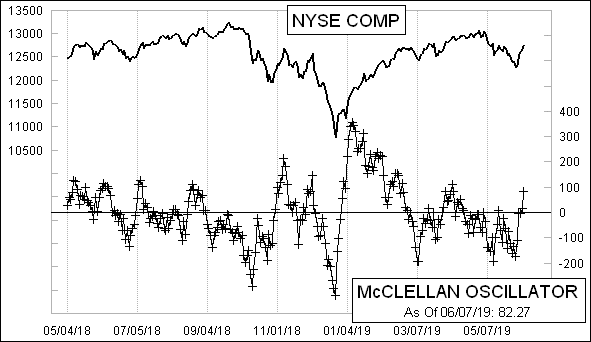
UP  above zero line


McClellanOsc_558.gif


https://www.marketin...llan-oscillator


#16 dTraderB

dTraderB

    Member

  • Traders-Talk User
  • 17,341 posts

Posted 08 June 2019 - 08:33 AM

Option_Sniper @option_snipper
FollowFollow @option_snipper
More

Option_Sniper Retweeted Option_Sniper

So far so good.... three index ES NQ YM all lower low on monthly then pulling up big.... all three now seen bullish engulfing on weekly.... likely first moving higher then premium killing into earnings.... $spx $comp $indu

Option_Sniper added,

Option_Sniper @option_snipper
remember what i said a few days back - this is WORST month of May for $spx in 7 years since 2012.... typically, after "sell-in-May", we gonna see lots of opportunities in June either up or down.... if we see lower low in June, could be great timing to load for pre-earnings run...
4:14 PM - 7 Jun 2019


#17 dTraderB

dTraderB

    Member

  • Traders-Talk User
  • 17,341 posts

Posted 08 June 2019 - 08:35 AM

SentimenTraderVerified account @sentimentrader
FollowingFollowing @sentimentrader
More

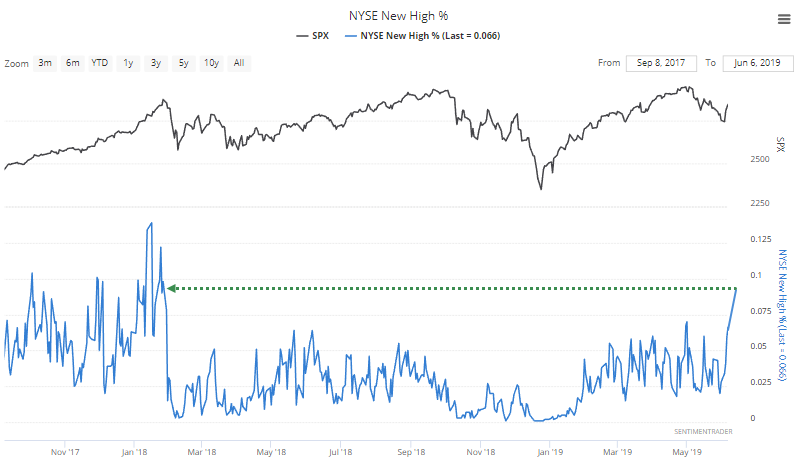
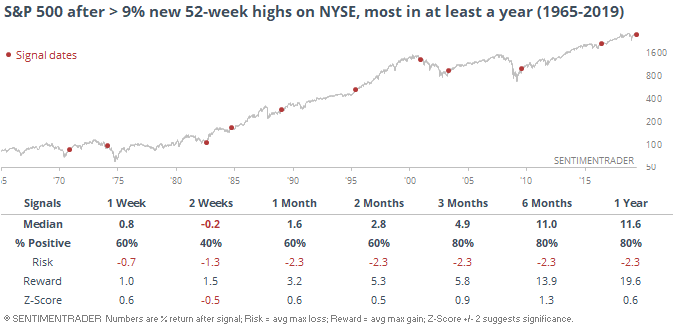
Most 52-week highs on the NYSE since last January. The first time it happened in more than a year, it was an excellent sign except for 1974 and 2000 which were massive failures. h/t @hmeisler

D8eojl2WwAEcJRN.png
 
D8eoru3XkAA02ww.png
11:26 AM - 7 Jun 2019


#18 dTraderB

dTraderB

    Member

  • Traders-Talk User
  • 17,341 posts

Posted 08 June 2019 - 08:36 AM

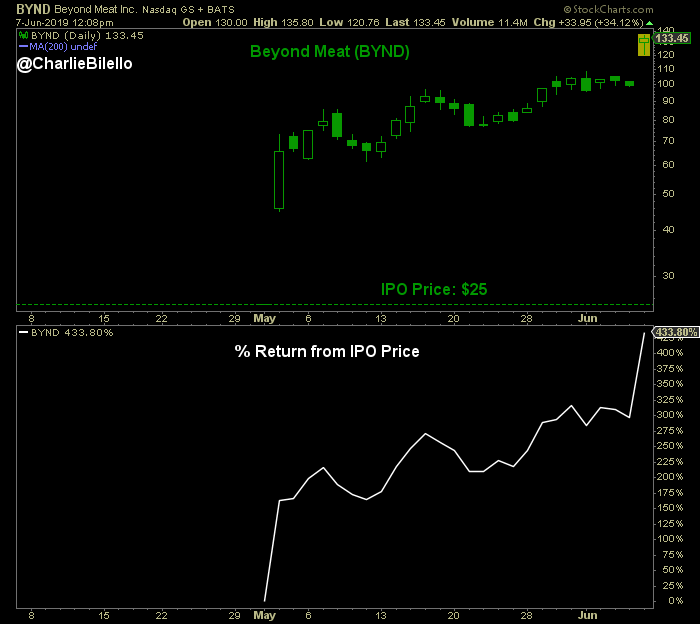
Cannot resist, will short on Monday, preferably PUTS


Charlie BilelloVerified account @charliebilello
FollowFollow @charliebilello
More

Beyond Meat is now over 5 times higher than its IPO price on May 1st. +433%. $BYND

D8eJ-JQXUAIi2Wh.png
9:11 AM - 7 Jun 2019


#19 dTraderB

dTraderB

    Member

  • Traders-Talk User
  • 17,341 posts

Posted 08 June 2019 - 08:37 AM

It's SENTIMENT.... that's the key indicator, all else is secondary... traders are bullihs, so trade the rally; when sentiment changes, then trade the decline


do not overanalyze


Charlie BilelloVerified account @charliebilello
FollowFollow @charliebilello
More

Stocks are moving higher today because the Fed might cut rates 4x because the economy is slowing and recessions are bullish but if economy rebounds the Fed might not cut rates at all and stocks will move higher because the economy is growing and expansions are even more bullish.

9:02 AM - 7 Jun 2019


#20 dTraderB

dTraderB

    Member

  • Traders-Talk User
  • 17,341 posts

Posted 08 June 2019 - 08:41 AM

Matt Thompson, CFA @dynamicvol
FollowFollow @dynamicvol
More

I know you want to know. Here's all days when $SPX >= +1% and $VXX was up on the day.

D8fCJJcXkAAwydR.png
1:16 PM - 7 Jun 2019