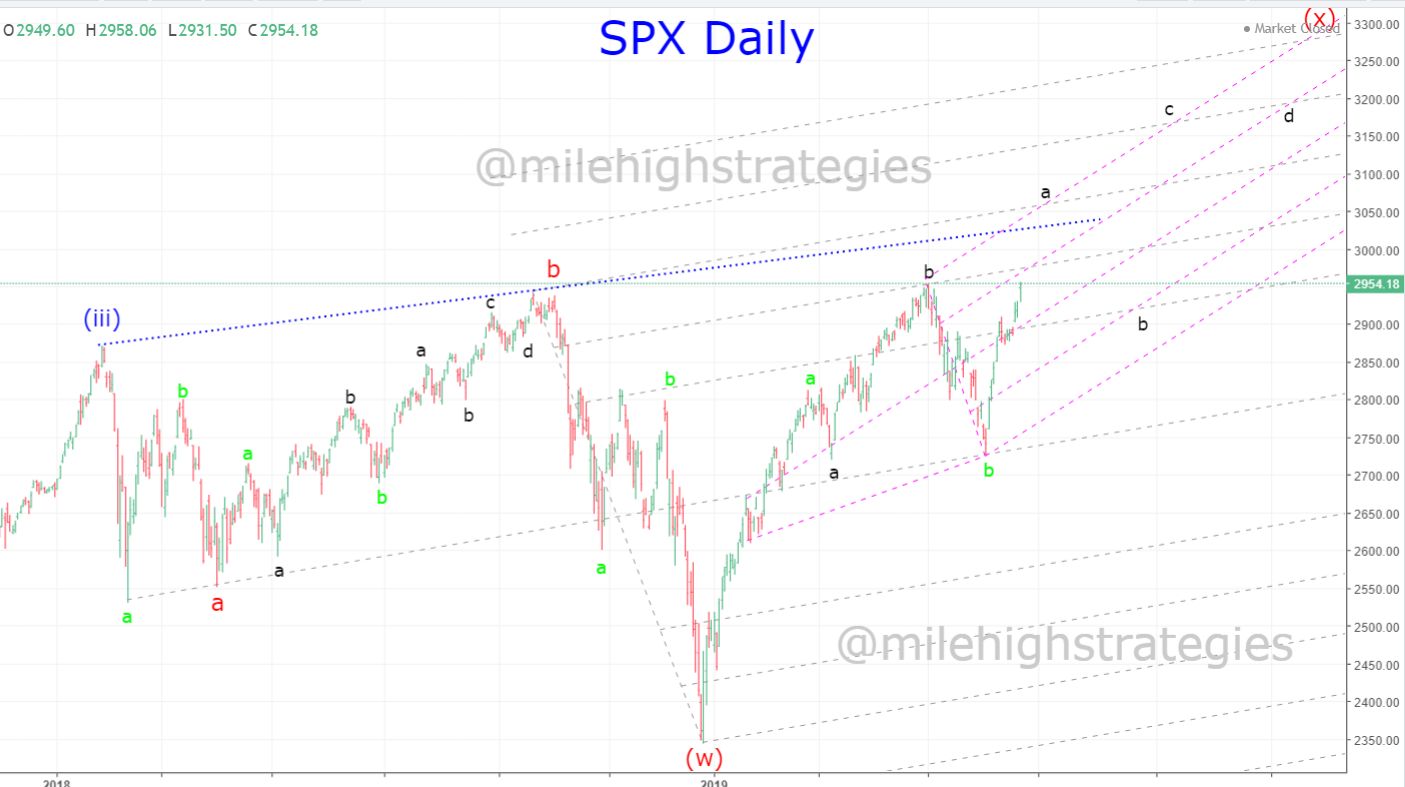
I typically reserve the updated SPX daily chart for Friday evenings, but I was curious last night what two Andrews Forks overlaid would produce, in light of my fractal outlook for a continued rally into year's end... and was intrigued by the potential for that high at the ~3290 range I've been calling for since early this year... twt.