Jump to content


Photo

SPX hits new high - Start Worrying


  • Please log in to reply
39 replies to this topic

#1 dTraderB

dTraderB

    Member

  • Traders-Talk User
  • 17,212 posts

Posted 22 June 2019 - 06:04 AM

So says Barrons

'

I will modify it to : Worry if the Trade War continues, if Mid East flares up....otherwise expect only a few % declline


FED can't save the markets all the time; it soon becomes pushing on a string as other factors become far more influential than the actions of the FED


The S&P 500 Hit a New High. Start Worrying.
  •  
  •  
  •  
  •  
June 21, 2019 9:39 pm ET

The range is a great home for cowboys. It’s a frustrating one for the stock market.

Yes, it’s tempting to ask what there is to be frustrated about, after the S&P 500index rose 2.2%, to 2950.46, this past week and even hit a new high on Thursday. The Dow Jones Industrial Average, meanwhile, gained 629.52 points, or 2.4%, to 26719.13, and the Nasdaq Composite climbed 3%, to 8031.71—just 0.4% and 1.6%, respectively, away from notching new highs of their own.


There was good reason to get excited. The Federal Reserve suggested strongly to investors that it could cut rates as early as its next meeting, in July. That’s usually great news for the stock market because lower rates generally mean higher valuations for equities, all else being equal.

Dow Jones IndustrialAverageSource: FactSet
Jan. ’19July ’1821000220002300024000250002600027000
S&P 500 IndexSource: FactSet
Jan. ’19July ’1823002400250026002700280029003000
NASDAQ Composite IndexSource: FactSet
Jan. ’19July ’18600065007000750080008500
Barron's 400 IndexSource: FactSet
Sept. ’18Jan. ’19May550600650700750800

At the same time, tensions between the U.S. and China appear to be ebbing, and prospects for some sort of trade deal—or at least no new tariffs—look better than they have since early May. Not even a flare-up in tensions between the U.S. and Iran could dampen the fun all that much.

Yet we must admit that the S&P 500’s new high isn’t all that. For starters, its record close of 2954.18 was just 0.3% higher than its old one of 2945.83, hit in April, and the index followed that up with a drop of 0.1%, not another gain. It also looks like the S&P 500 might be repeating a previous pattern of touching a new high—barely—before sliding back: Its last record high in April was just 0.5% higher than its September 2018 high of 2930.75. If the S&P 500 can’t break out, then it is, by definition, stuck in a range.

Though the Fed could cut interest rates as soon as July, there’s evidence that the stock market already reflects that possibility, argues UBS strategist Keith Parker. The S&P 500, after all, now trades at 17.3 times 12-month forward earnings forecasts, according to Bloomberg data, not far off its September peak of 17.34 times.

“U.S. valuations have moved back to the highs of last fall, suggesting lower rates are priced [in],” Parker writes.


That makes the G20 gathering on June 27-28, where U.S. President Donald Trump and Chinese President Xi Jinping are supposed to meet, all the more important, says Dave Donabedian, chief investment officer at CIBC Private Wealth Management.

The trade war has already had an impact on manufacturing activity—the Empire State Manufacturing index suffered its largest tumble on record in May—but far less of an impact on consumers, who continue to spend. A détente in the trade war could help give manufacturing a boost, but another round of tariffs could cause consumers to finally throw in the towel. “The divergence won’t last forever,” Donabedian says. “The trade issue is very critical here.”

The market appears optimistic that everything will work out just fine. MKM strategist Michael Darda can’t help thinking back to the selloff in the last quarter of 2018. Back then, the S&P 500 tumbled nearly 20%, and investors were worried about a recession despite little evidence that one was on the way.

Now, the S&P 500 is trading near its all-time high, even as the yield curve—one of the most reliable predictors of a recession—has been inverted for weeks.

“It’s the inverse setup of late last year,” Darda says. “Why not be a little more defensive here?”

Why not, indeed.

Write to Ben Levisohn at Ben.Levisohn@barrons.com


#2 dTraderB

dTraderB

    Member

  • Traders-Talk User
  • 17,212 posts

Posted 22 June 2019 - 06:11 AM

The Brits do produce a few good things, example:


The charts that matter: the great central bank-sponsored rally


https://moneyweek.co...sponsored-rally


#3 dTraderB

dTraderB

    Member

  • Traders-Talk User
  • 17,212 posts

Posted 22 June 2019 - 06:13 AM

I am honored to have the same opinion of the Great Carl:

Short-Term Bearish Indications
Carl Swenlin |  June 21, 2019 at 07:06 PM
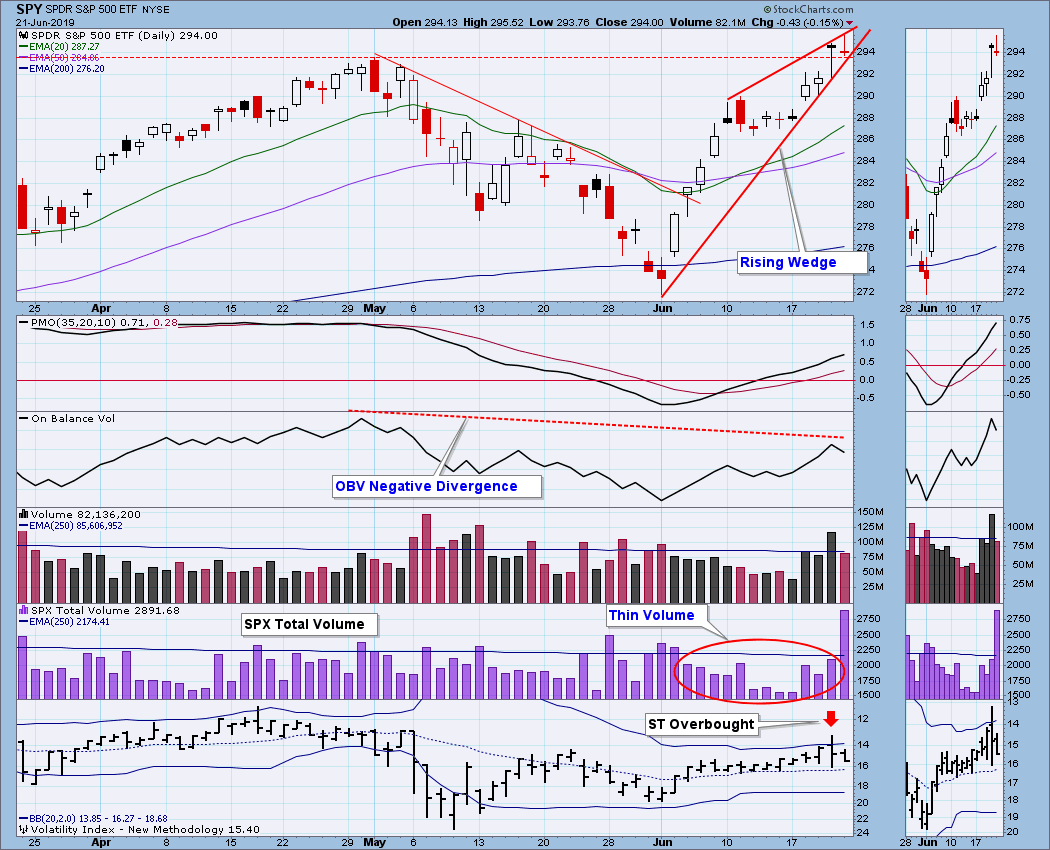
The market closed at an all-time high on Thursday, then on Friday it hit an all-time intraday high; however, there are some technical problems: (1) a bearish rising wedge pattern has formed; (2) there is an OBV negative divergence; (3) volume has been thin since the June low; and (4) the VIX penetrated the top Bollinger Band on Thursday, indicating that a short-term price top may be in. To clarify, SPX Volume on Friday was huge, but that was because of end-of-quarter options expiration, not an indication of some kind of blow-off. Below let's see how all this fits in the broader picture.

1561154145636551874432.png

The DecisionPoint Weekly Wrap presents an end-of-week assessment of the trend and condition of the stock market (S&P 500), the U.S. Dollar, Gold, Crude Oil, and Bonds.

Watch the latest episode of DecisionPoint on StockCharts TV's YouTube channel here!

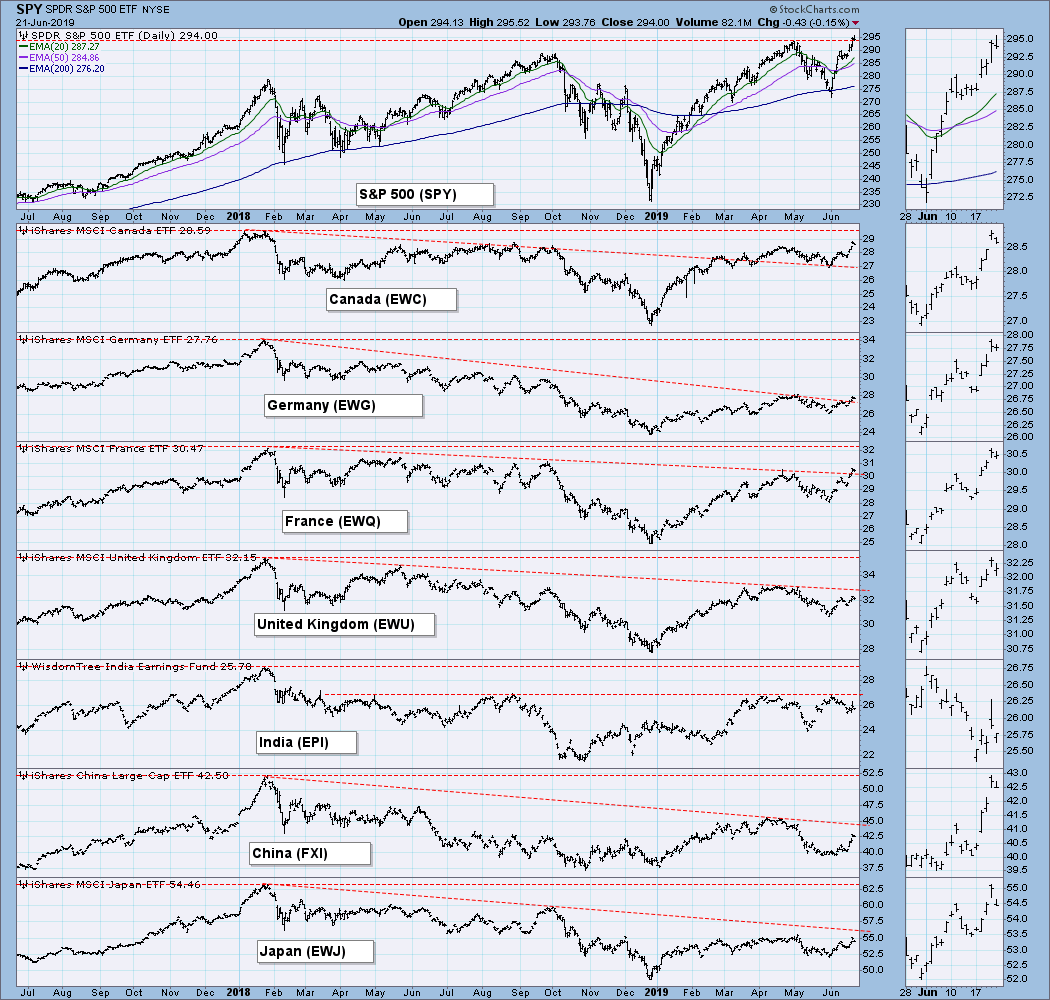
GLOBAL MARKETS

15611519938991807101669.png

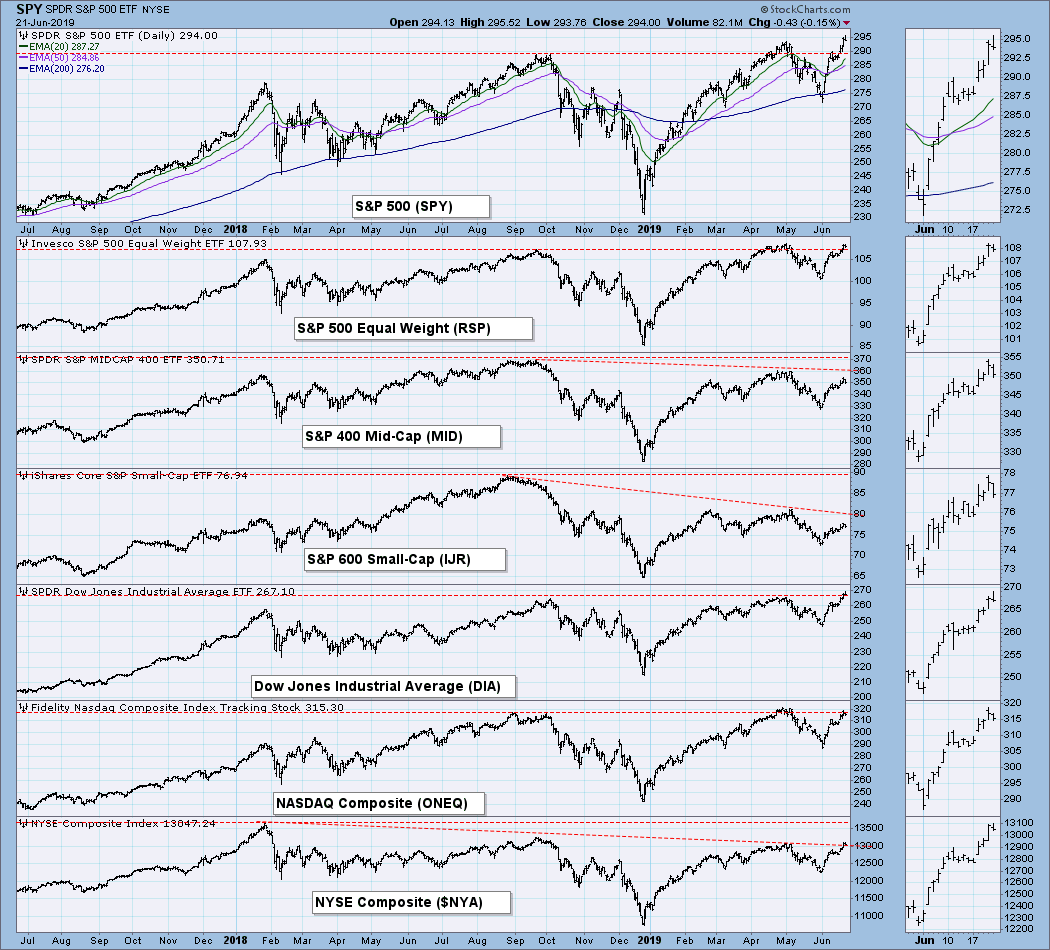
BROAD MARKET INDEXES

15611520304091988110171.png

SECTORS

Each S&P 500 Index component stock is assigned to on


https://stockcharts....ndications.html


https://stockcharts....ndications.html


Edited by dTraderB, 22 June 2019 - 06:13 AM.


#4 dTraderB

dTraderB

    Member

  • Traders-Talk User
  • 17,212 posts

Posted 22 June 2019 - 06:16 AM

GOLD is exciting many people:


ST thinks there are a few bullish signs for SPX:

Missing out

The S&P has fully recovered from its May pullback and sits at a new high. Yet the latest survey of individual investors from AAII still shows more bears than bulls. Their persistent pessimism is rare, with only four similar cases in the past 30 years.

Big push

The S&P 500 hit a new high, and the percent of issues on the NYSE at a new high hit its highest level in 350 days. When both hit a 350-day together, the S&P was higher 36 out of 41 times a year later, with average risk of only 3.1% versus average reward of 15.2%.

Low debt

Over the past 3 months, margin debt as a percentage of stocks’ market cap has averaged only 1.88%, the lowest in more than a decade.


https://www.sentimen...me-in-25-years/


#5 dTraderB

dTraderB

    Member

  • Traders-Talk User
  • 17,212 posts

Posted 22 June 2019 - 06:22 AM

Not an EW fan but I listen; may or may not agree:


From one of the few EWavers I follow:


"Well, the bounce turning into a full fledged rally and it did so quickly. In the process the S&P 500 delivered some impressive price and breadth patterns along the way. For example:


Bullish Developments

  • Yesterday’s (Tuesday, June 4) rally was supported by exceptional breadth, with 81.48% of NYSE stocks advancing. In addition to Tuesday’s strength, Monday saw more stocks advancing (65.03%) despite a 6-point loss. This is generally a positive for stocks.” - June 5, Profit Radar Report
  • Sunday’s PRR showed the spike in new 52-week highs (116 for the S&P 500). Defensive sectors (like staples, utilities, and health care) saw about twice as many new highs as non defensive sectors. Some may interpret this as a bearish ‘risk off’ rally, but historically that’s not been the case." - June 12, Profit Radar Report
  • Retail investors polled by the American Association of Individual Investors (AAII) are unusually bearish (below 30% bulls for 5 consecutive weeks). When this crowd has been this bearish during a bull market, the S&P 500 was higher 3 months later every time." - June 16, Profit Radar Report
  • "By one measure, hedge funds have the smallest exposure to equities since 2013. This is highly unusual considering that the S&P 500 is only 2% from its all-time high. Since 2009, when hedge funds were this bearish, the S&P 500 was higher 3 months later 90% of the time.” - June 16, Profit Radar Report
  • My favorite liquidity indicator reached new all-time highs this week. Since the beginning of this bull market in 2009, the NYC a/d line reached new all-time highs before the S&P 500 eight other times. On average, it took the S&P 45 days to reach a new high or all-time high (the 2007 all-time high was not exceeded until April 10, 2013). 1 year later, the S&P 500 was higher every time. 2, 3, 6 months later, the S&P was higher 7 out of 8 times.” - June 16, Profit Radar Report

Bearish Factors


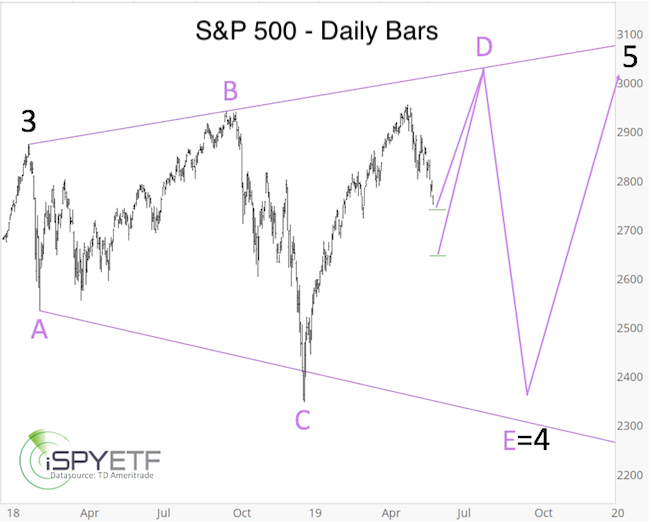
The Elliott Wave Theory pattern is still not distinctly bullish. I published four different scenarios in the June 2 Profit Radar Report. The most bearish one was eliminated on June 5. Two of the three remaining ones projected new all-time highs, and the third allowed for new all-time highs.


Shown below is one of the 3 possible scenarios (published in the June 2 Profit Radar Report). The second one has a trajectory similar to this one, and the third one is much more bullish.


spxP62019.png


Short-term Factors


As the first chart shows, RSI-2 is over-bought and RSI-35 is lagging, so technical indicators allow for some short-term risk. The May all-time high should provide some resistance, but a rally towards and into 3,000 is possible.


I’ll be watching the next inflection zone to see if the bullish developments outlined above will overpower the lack of a clearly bullish Elliott Wave Theory pattern.


Read more at https://www.ispyetf.com


#6 dTraderB

dTraderB

    Member

  • Traders-Talk User
  • 17,212 posts

Posted 22 June 2019 - 07:11 AM

Stay the course, he says

BUY & HOLD?

Do people realize the FED RATE CUT has now been priced into the market?  If SPX is at or near record highs, will the FED still cut in July? 


"New highs forged for the S&P and Dow 30 as the secular bull market continues. The majority of pundits are left behind again.

Sentiment among fund managers is as bearish as it can get, and that’s a positive for the bulls.

Given the weight of the evidence, the Fed made the right decision not to cut rates now.

The long-term trend remains in place and for the moment that is all one needs to know"

https://seekingalpha...ket-stay-course

New highs forged for the S&P and Dow 30 as the secular bull market continues. The majority of pundits are left behind again.

Sentiment among fund managers is as bearish as it can get, and that’s a positive for the bulls.

Given the weight of the evidence, the Fed made the right decision not to cut rates now.

The long-term trend remains in place and for the moment that is all one needs to know


#7 fib_1618

fib_1618

    Member

  • Traders-Talk User
  • 10,145 posts

Posted 22 June 2019 - 07:33 AM

1) When has Barrons EVER been right picking tops and bottoms? They have always been a contrarian indicator.


2) With all due respect for Carl, rising wedges include declining daily volume characteristics. In this case, it would be a leading diagonal.


3) This is exactly why bull markets are said to "climb a wall a worry"...it really all comes down to one thing: the directional flow of investment capital as measured by the advance/decline data.


Everything else is subordinate.


Fib


Better to ignore me than abhor me.

“Wise men don't need advice. Fools won't take it” - Benjamin Franklin


"Beware of false knowledge; it is more dangerous than ignorance" - George Bernard Shaw


Demagogue: A leader who makes use of popular prejudices, false claims and promises in order to gain power.

Technical Watch Subscriptions


#8 12SPX

12SPX

    Member

  • Traders-Talk User
  • 12,477 posts

Posted 22 June 2019 - 09:08 AM

Thanks db, you really should start your site you have an incredible knack of showing great articles on both sides of the case, excellent morning reads.   Fib, the advance/decline data is that all equal weighted you look at not just FANG stocks?  Does it also include up and down volume?  


#9 dTraderB

dTraderB

    Member

  • Traders-Talk User
  • 17,212 posts

Posted 22 June 2019 - 10:35 AM

64236847473256ab53d4ab6790278b2b_bigger.David Larew @ThinkTankCharts
FollowFollow @ThinkTankCharts
More

Put Call indicator - back into the too bullish range - Looking for a divergence here.

D9qNkYDW4AAmTjx.png
 

Edited by dTraderB, 22 June 2019 - 10:40 AM.


#10 dTraderB

dTraderB

    Member

  • Traders-Talk User
  • 17,212 posts

Posted 22 June 2019 - 10:38 AM

Thanks db, you really should start your site you have an incredible knack of showing great articles on both sides of the case, excellent morning reads.   Fib, the advance/decline data is that all equal weighted you look at not just FANG stocks?  Does it also include up and down volume?  


Thanks, but do not have the time nor inclination

I manage funds for my family & relatives, and also my own daytrading & options trading

I enjoy posting stuff that I read & follow, sharing info on FF, and also on my family/relative forum. 

Can't handle anything more than that.  I prefer allocating the rest of time for family.