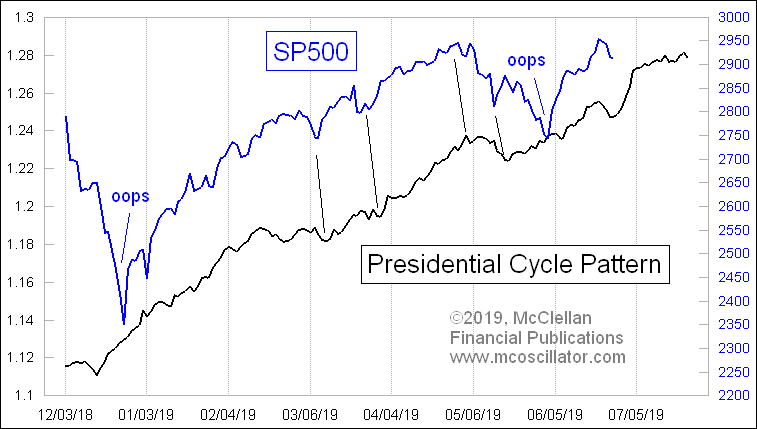
Agreeing with TIM ORD who thinks this is about the SPX low for this pullback (today's low) and we rally into July 4th
However, if this happens, then it will be a temporary and down it goes again
DEAL? a fake deal but the market will rally -- so DEAL plus JUly 4 equals a rally of 3 to 4 %
If market cannot rally in the above then we have seen an IT top
Here is TIM's stuff:
SPX Monitoring purposes: Long SPX on 6/25/19 at 2917.38.
Monitoring purposes GOLD: Long GDX on 1/29/19 at 21.96.
Long Term Trend SPX monitor purposes: Sold long SPX on 5/6/19 at 2932.61= gain 5.96%.
 The chart above is the three-week moving average of the American Association of Individual Investors Bull/Bear Ratio, going back to late 2010. We have been showing this chart recently because is relative to the current timeframe. We previously said that “[i]ntermediate-term rallies have occurred in the SPX when this ratio reached .75 and lower. The most recent low reading came in at .53 on June 3; it currently has bumped up to .87. Going back to 2010, this ratio reached at least 1.25 before any worthwhile SPX top formed. This week could see a retracement in the SPX, but, in general, the market should move higher in the coming weeks. We will be looking for a bullish setup in the coming days.” Today’s pull back did produce a bullish setup.
 The SPY was up four days in a row going into last Thursday. When the SPY is up four days in a row, it closes higher within the next five days 87% of the time, with an average gain of 1.1%. Also on today’s decline, the TICK and TRIN did reach panic levels, which suggests a low is being reached from today to as late as two days later (which would be Thursday). July 4 is next Thursday (markets are closed) and holidays commonly produce reversals in the market. We wouldn’t be surprised if market rallied to the July 4 timeframe. (Long SPX on 6/25/19 at 2917.38.)
https://stockcharts....ne-25-2019.html