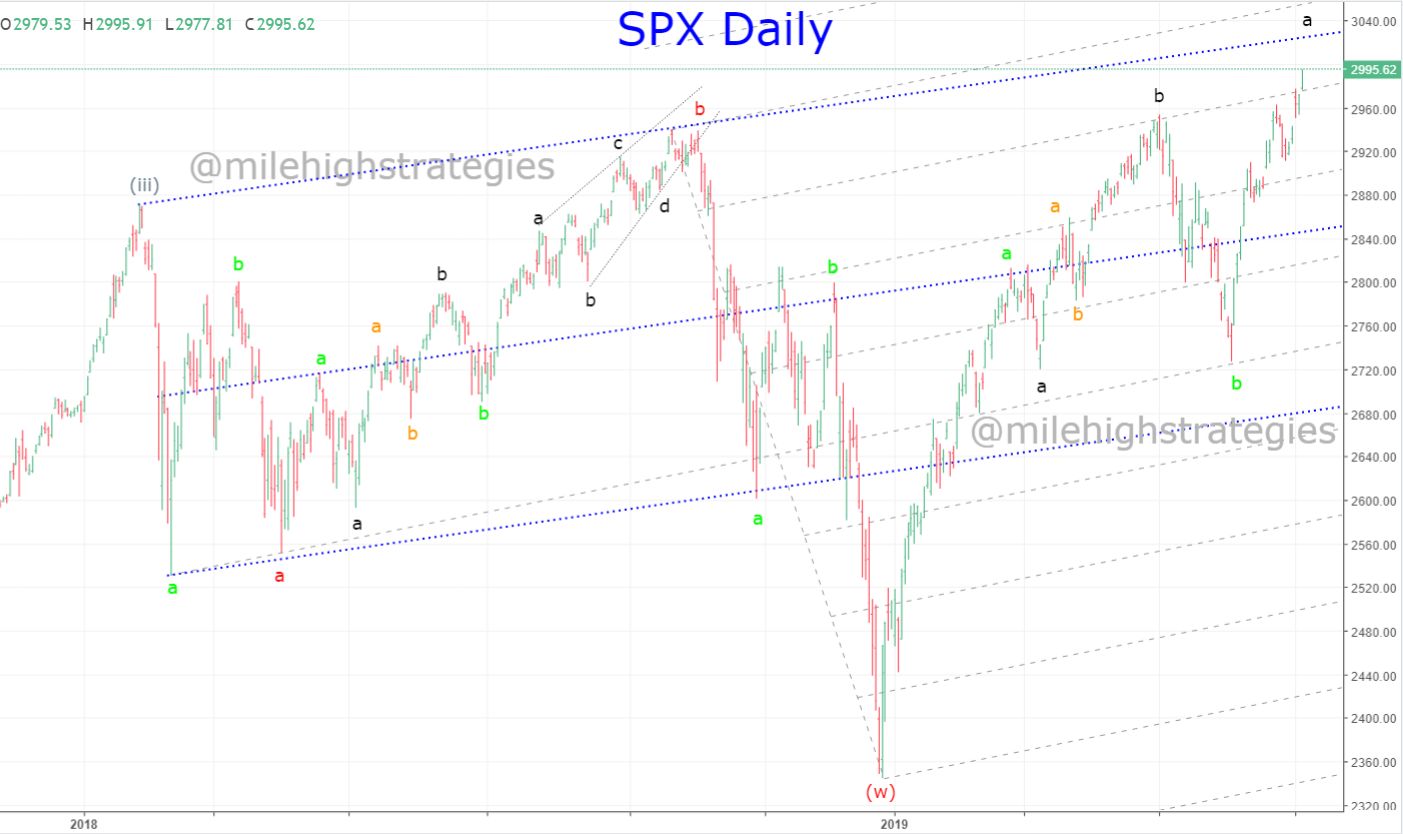
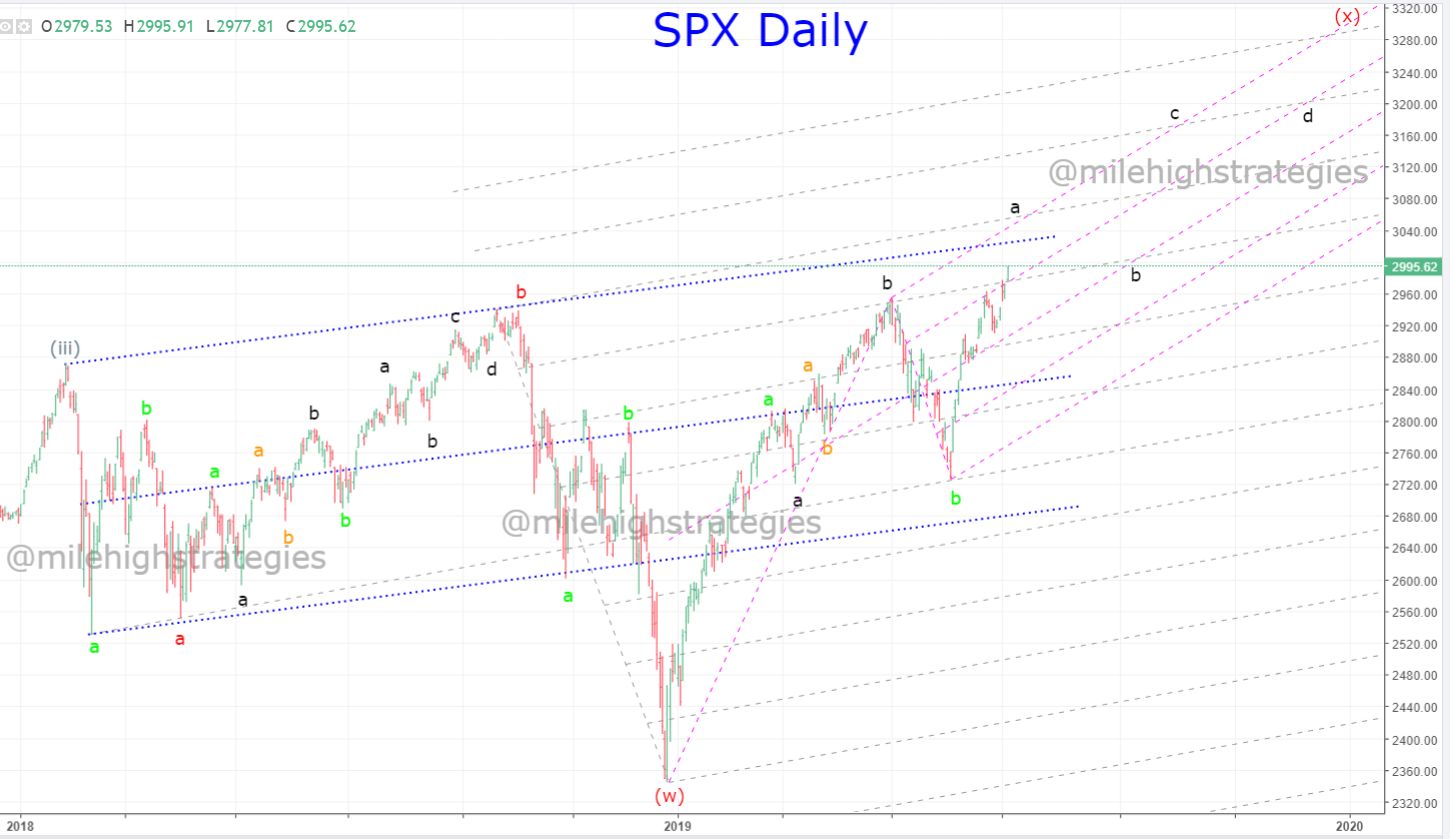
Curious what happened to this post, why didn't it work, why will this one be correct? "Posted 10 June 2019 - 10:46 AM
Today is an important top in my work with a forecast of 2896 SPX +/-. Overall, down into August 28th below Dec 26, 2018 low!!"
Jeff Clark's Market Minute Don’t Be Fooled by a Low VIX…
Be careful. One of the most consistent indicators I follow is on the verge of generating a broad stock market sell signal…
We came into this week expecting higher stock prices, but also willing to sell stocks into that rally. That seems like an even better strategy today than it did on Monday.
The S&P 500 rallied to a new all-time high on Monday. It added slightly to the gains yesterday. And, in the process of that buying binge, the Volatility Index (VIX) has collapsed.
We’re on the verge of a sell signal right now. Take a look…
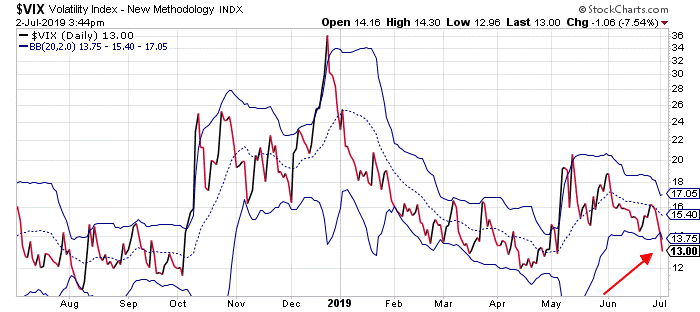
The VIX closed slightly below its lower Bollinger Band on Monday. It dipped even farther below the band yesterday. When the VIX rallies and closes back inside the bands – maybe today, maybe Friday – we’ll have our sell signal.
So, as I mentioned on Monday, traders should use the rally this week as a chance to take some profits off the table. We’ll probably have a chance to put money back to work at a lower level sometime over the next few weeks.
Best regards and good trading,
https://www.jeffclarktrader.com/
Edited by robo, 03 July 2019 - 07:34 AM.