Jump to content


Photo

TOPPING in process ... on Friday or OPEX next week.


  • Please log in to reply
17 replies to this topic

#1 dTraderB

dTraderB

    Member

  • Traders-Talk User
  • 17,193 posts

Posted 10 July 2019 - 03:33 PM

A ultra dovish FED guarantees a July rate cut, at least 25 bps, but all the SPX can do is rally above the 3K level and then close at 2992


This is a top being formed, either this week or in OPEX next week, but it is a top. 


The rate cut is already baked into this market and soon the docus will be on earnings. 

Looking for a ST top, then down, and UP into the FED rate-cut day


TIM ORD thinks there will be a slight pullback:
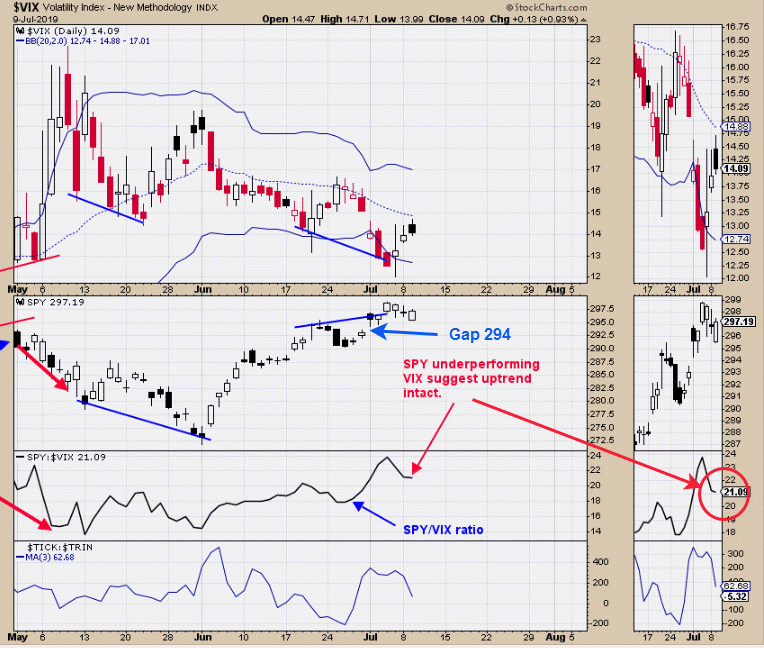
1562776160414895279905.gifThe second window up from the bottom in the above chart is the SPY/VIX ratio. This ratio rises and falls with the SPY. The ratio turned down last Friday (one of the reasons we sold our SPX positions) and today it continued lower, suggesting market could remain weak for the short term. There is an open gap near 294 that could be a downside target. Not looking for a big decline here, just a consolidation that, once completed, could lead to new highs.
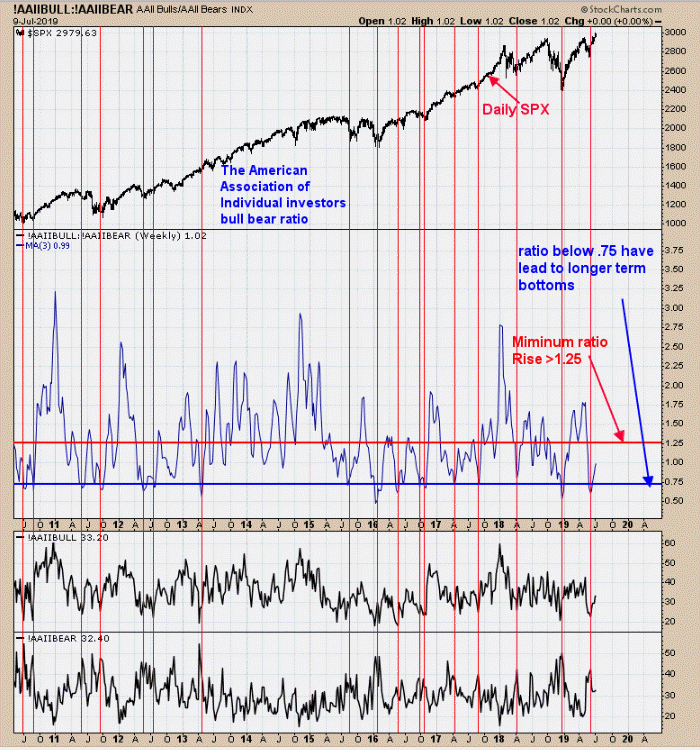
1562776189593502914714.gifAbove is a longer-term view for the SPX. The above chart is the three-week average of the “American Association of Individual Investors Bull/Bear Ratio” (third window up from the bottom). When this ratio is below .75, the market is near an intermediate-term low (which was hit in late May). Intermediate-term tops usually don’t form until this ratio reaches above 1.25. The current reading is .99. Next week is options expiration week, which has a bullish bias. It is common for a low to form between Wednesday (tomorrow) to as late as Tuesday during options expiration week. We will be looking for panic and a bullish setup in the coming days, ideally in the gap range near 294 SPY. (Sold SPX 7/5/19 & 2990.41= Gain of 2.50%; Long SPX on 6/25/19 at 2917.38.)


https://stockcharts....uly-9-2019.html


#2 tsharp

tsharp

    Member

  • Traders-Talk User
  • 1,487 posts

Posted 10 July 2019 - 05:18 PM

Nearing a ST top... the Fed is not likely to offer a rate cut this month, so a wave-b pullback in July/Aug would be in the cards...


SPX-D-7-10-19.jpg


#3 dTraderB

dTraderB

    Member

  • Traders-Talk User
  • 17,193 posts

Posted 11 July 2019 - 05:46 AM

Holding my TLT short and may add to it above 133


1562825770777292408808.gif

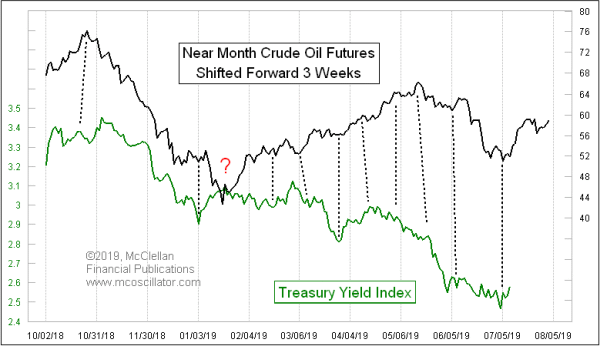
I like getting answers ahead of time, and I really like chart pattern leading indications, like the one in this week’s chart, that can give us useful answers about what lies ahead. The movements in crude oil prices tend to show up again about 3 weeks later, in the movements of bond yields, with the dance steps getting repeated.

Sometimes the Treasury Yield Index (TYX) does its own artistic interpretation of those dance steps. And sometimes it goes completely off script for a while, but then works extra hard to get back on track with what crude oil says should have been happening. It is not a perfect leading indication - it is merely very good.

Crude oil prices bottomed back on June 12, so that should have meant a bottom for the TYX ideally on July 5.  It actually bottomed one trading day early, on July 3. That's close enough to the target for a rifle shot fired 3 weeks before.

The rally in crude oil prices since June 12 should now see its echo in rising bond yields over the next 3 weeks, especially over about the next week and a half.

Tom McClellan,
Editor
The McClellan Market Report
www.mcoscillator.com

https://stockcharts....ond-yields.html


#4 dTraderB

dTraderB

    Member

  • Traders-Talk User
  • 17,193 posts

Posted 11 July 2019 - 06:55 AM

  1. VIX put/call ratio 119%

  2.  More

    Equity put/call ratio 51%


#5 dTraderB

dTraderB

    Member

  • Traders-Talk User
  • 17,193 posts

Posted 11 July 2019 - 06:56 AM

Helene Meisler @hmeisler
FollowFollow @hmeisler
More

AAII Bulls didn't have time to turn bullish, pretty much stayed the same. But those bears? Scurrying away fast now. Down 5 points this week. Here's the 4 wk ma of bears.

D_MDHjqWsAA1zCK.png
3:34 AM - 11 Jul 2019


#6 dTraderB

dTraderB

    Member

  • Traders-Talk User
  • 17,193 posts

Posted 11 July 2019 - 06:57 AM

zillions of cash on the sidelines ... can fuel this rally all the ay to SPX 3500


SentimenTraderVerified account @sentimentrader
FollowFollow @sentimentrader
More

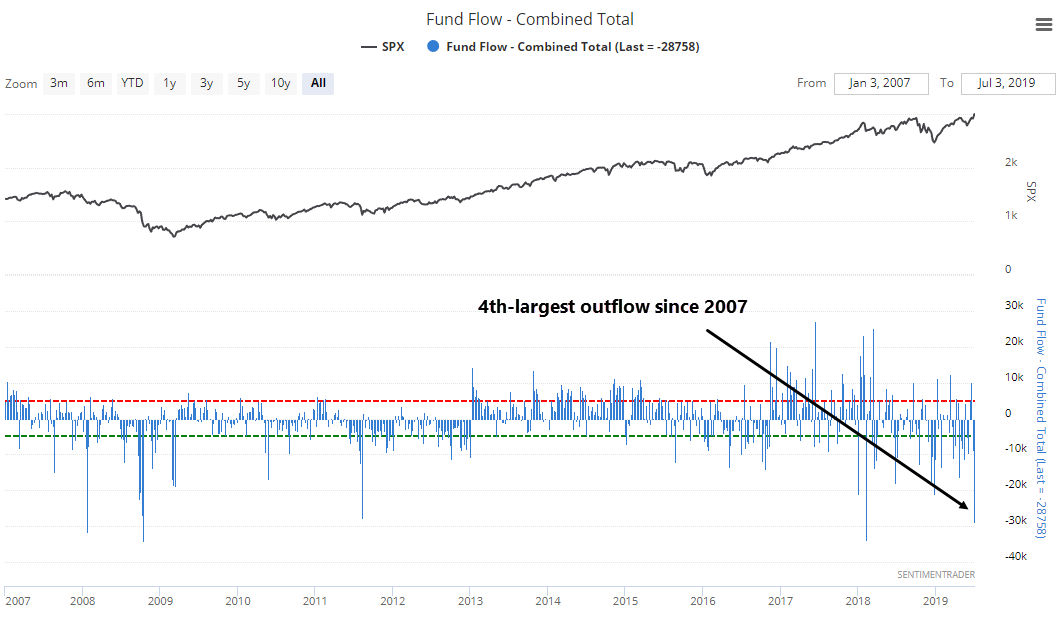
According to the Investment Company Institute, investors pulled more than $28 billion from equity funds (mutual and exchange-traded) in the week before Independence Day. 4th-largest outflow in over a decade.

D_IUeniWkAAWe5Q.png
10:12 AM - 10 Jul 2019


#7 dTraderB

dTraderB

    Member

  • Traders-Talk User
  • 17,193 posts

Posted 11 July 2019 - 07:00 AM

David Larew @ThinkTankCharts
FollowFollow @ThinkTankCharts
More

SPY - negative RSI divergence at the highs generally means sideways to down coming up. Weird Wollie near the highs - rule is next Friday the SPY will be low.

D_MUx4-XkAAW2P5.jpg
4:52 AM - 11 Jul 2019


#8 dTraderB

dTraderB

    Member

  • Traders-Talk User
  • 17,193 posts

Posted 11 July 2019 - 07:00 AM

David Larew @ThinkTankCharts
FollowFollow @ThinkTankCharts
More

SPY - Bearish Butterfly gets even larger yesterday. Total Volume, uh not what you want to see with breakouts. Negative RSI divergence - favors sideways to down after the open. 3000 head line number, eh?? All sectors are at highs, even defensive stocks???

D_MSaxEWwAEkX4D.jpg
4:42 AM - 11 Jul 2019


#9 dTraderB

dTraderB

    Member

  • Traders-Talk User
  • 17,193 posts

Posted 11 July 2019 - 07:02 AM

Meanwhile, in case you forgot:


Chinese and US negotiators held a phone conversation. Chinese side only confirmed the phone conversation, without mentioning the conversation is “constructive” as described by the US side. So cautious it seems Chinese side has learned lessons from previous changes.

3:39 AM - 10 Jul 2019


#10 dTraderB

dTraderB

    Member

  • Traders-Talk User
  • 17,193 posts

Posted 11 July 2019 - 07:03 AM

Scratching head...WTF??


Holger Zschaepitz @Schuldensuehner
FollowFollow @Schuldensuehner
More

Totally absurd: #Germany sold new 10y Bund w/no coupon for 1st time since 2016. Investors paid record yield of -0.26% to lend Germany money. Neg yield means investors who buy the paper will get back less than amount they paid when the bond matures in 2029. https://www.ft.com/content/7591b908-a2ea-11e9-974c-ad1c6ab5efd1 

D_LJAODXkAA5yjj.jpg
12:08 AM - 11 Jul 2019