Jump to content


Photo

What Scary Thing Do Bond Traders Know? Topping in progress....


  • Please log in to reply
17 replies to this topic

#1 dTraderB

dTraderB

    Member

  • Traders-Talk User
  • 17,212 posts

Posted 16 July 2019 - 06:53 AM

From ST:


End to inversion

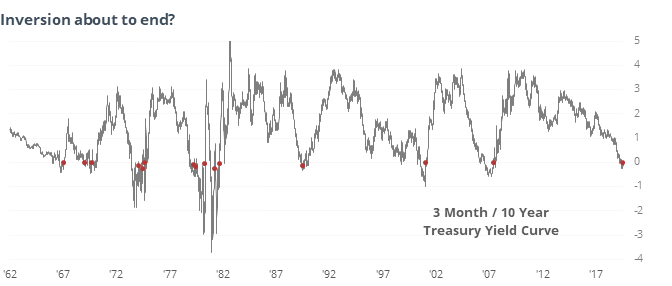
The spread between 3-month and 10-year Treasury yields has been inverted for more than a month, with the shorter-term bills yielding more than the longer-term notes.

1563200273974.jpg

At 35 days, the current stretch of an inverted curve is the longest since 2007. When that spread turns positive, it has been more of a negative for stocks, and it’s nearing that scenario now. In other markets, the U.S. dollar did not react well to the ends of these inversions.

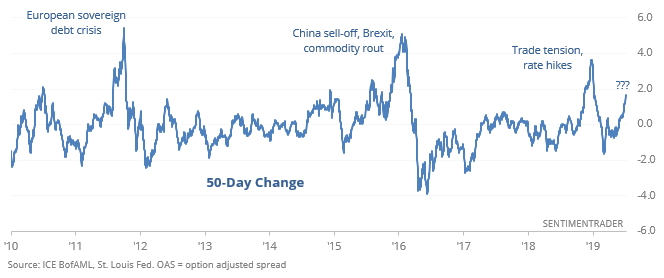
Fleeing risky bonds

The riskiest of junk bonds are seeing some selling pressure. Their spread over Treasuries is widening much faster than safer bonds that are rated higher.

1563200322768.jpg

Over the past 50 days, the difference between those risky bonds and safer ones has expanded quickly, prompting some to wonder what bond traders know. Like the yield curve inversions, the times when it served as a warning led to some very large declines, and the overall risk/reward was negative across every time frame.

The latest Commitments of Traders report was released, covering positions through Tuesday

The 3-year Min/Max Screen shows that “smart money” hedgers established new multi-year long exposure to copper and cotton, while selling corn even more aggressively. By the time they were this exposed to copper over the past 7 years, it was enough to stem the selling in that contract 6 times, with an exception in late 2014.

New lows for small-caps

The Russell 2000 hit a 52-week low relative to the S&P 500 on Thursday, while the S&P hit a new high. Since 1979, the Russell continued to underperform a year later 91% of the time.

https://www.sentimen...d-traders-know/


#2 dTraderB

dTraderB

    Member

  • Traders-Talk User
  • 17,212 posts

Posted 16 July 2019 - 06:54 AM

Liz Ann SondersVerified account @LizAnnSonders
FollowFollow @LizAnnSonders
More

Global Risk Index from @blackrock at multi-year high @SoberLook

D_mCAErXkAIJ1my.jpg
4:39 AM - 16 Jul 2019


#3 dTraderB

dTraderB

    Member

  • Traders-Talk User
  • 17,212 posts

Posted 16 July 2019 - 06:56 AM

This is only a few lines from an informative column at the link below:


Crowd Sentiment

As regular readers know, I like the Ned Davis Research Crowd Sentiment Poll because it’s an amalgamation of about seven distinct sentiment measures—including both attitudinal and behavioral measures. As you can see in the chart (and accompanying table) below, optimism has followed the stock market higher, and is now back in the “extreme optimism” zone. In that zone historically, as you can see in the table, stocks have tended to struggle on an annualized basis. 

Crowd Sentiment Inching Back to Extreme Territory

071519_NDR%20CSP.png?itok=Mt-F_gfF

071519_NDR%20CSP%20Table.png?itok=5hKjLg

Source: Charles Schwab, Ned Davis Research (NDR), Inc. (Further distribution prohibited without prior permission. Copyright 2019© Ned Davis Research, Inc. All rights reserved.), as of July 9, 2019.

Not all sentiment measures are stretched

One of the aforementioned seven sentiment measures imbedded in the CSP is the survey conducted weekly by the American Association of Individual Investors (AAII). This is currently one of the more subdued sentiment readings—with the percentage of AAII members that are bullish no worse than about neutral, as you can see in the chart below. The yellow dots on the chart represent points when the Dow crossed round number thresholds. As you can see, Dow 25k and Dow 26k were accompanied by much higher bullishness than Dow 27k. This is a sentiment measure the bulls can continue to cheer.

AAII Bulls Less Impressed

071519_AAII%20Bullish.png?itok=lnr10Q_c

Source: Charles Schwab, American Association of Individual Investors (AAII), Bloomberg, as of July 12, 2019.

Latest round numbers took fairly long

As reported by The Wall Street Journal, it took 216 days for the S&P 500 to move from its first cross above 2900 (last August) to its first cross above 3000 (last Friday)—which is one of the longest stretches between round numbers in quite a few years. As noted by ST, because it gets easier for the index to hurdle each round number as it climbs (the percentage change is less), it’s been rare to see a streak this long since the S&P first surpassed 600 in the mid-1990s. For what it’s worth, subsequent returns were generally better after long stretches between round numbers than shorter stretches.

Don’t fight the Fed

Another factor impacting sentiment has been monetary policy—in particular, the likelihood that the Federal Open Market Committee (FOMC) cuts the fed funds rate by 25 basis points at the end of this month. Long-time readers know that the phrase “Don’t fight the Fed” was coined by my first boss/mentor, the late-great Marty Zweig. That message has been in full force recently; leading many to conclude that we have moved from the original “Greenspan put” to the “Powell put.” That view kicked in when, in January this year, the Fed shifted from a hawkish to a dovish stance following the market rout into the December 2018 low. It’s based on the belief that the Fed has the power—and will use it—to keep the stock market in ascent.

This belief is perhaps why we have seen a sharp change in the market’s reaction to and behavior around economic data surprises. Take a look at the charts below—the left chart covers the first 16 months of the Fed’s rate tightening cycle (beginning in December 2015), and the second of which dates from March 2018 to the present. Citi’s Economic Surprise Index tracks how economic data is coming relative to expectations (it’s not a measure of the level of growth).

https://www.schwab.c...bers-us-indexes


#4 dTraderB

dTraderB

    Member

  • Traders-Talk User
  • 17,212 posts

Posted 16 July 2019 - 06:59 AM

Holger Zschaepitz @Schuldensuehner
FollowFollow @Schuldensuehner
More

Long US Treasuries remains the most crowded trade according to BofAML's Global Fund Manager Survey. The market leadership has been relatively narrow since 2013, shifting from high yielding debt; long US$; long Quality; long Tech; long Emerging Markets; and now long US Treasuries.

D_lr0QNXkAAAfD2.jpg
3:03 AM - 16 Jul 2019


#5 dTraderB

dTraderB

    Member

  • Traders-Talk User
  • 17,212 posts

Posted 16 July 2019 - 06:59 AM

Holger Zschaepitz @Schuldensuehner
FollowFollow @Schuldensuehner
More

Sentiment among investors improves slightly in July. Fund Managers polled by BofAML cut their cash level from 5.6% to 5.2%: cash is still elevated as bearish EPS & GDP outlook likely means "pain trade" = higher stocks & yields.

D_lpCUDXsAUFSgT.jpg
2:50 AM - 16 Jul 2019


#6 dTraderB

dTraderB

    Member

  • Traders-Talk User
  • 17,212 posts

Posted 16 July 2019 - 07:01 AM

I always try to read Tom's tweets, informative:


  1. And here is IVV. Both VOO and IVV have pretty consistent inflows over time, especially VOO. So it is not really a story, but Bloomberg did not let that stop them from making it sound like one. (3/3)

    D_i8JZGXkAAaRZ8.png
    0 replies4 retweets23 likes
    Reply
     
     
    Retweet
     4
     
     
    Like
     23
  2.  

    The real inflows are taking place in VOO (Vanguard) and IVV (iShares), which have lower fees. Here is VOO. (2/3)

    D_i7-CqXYAA-Ykv.png
    1 reply1 retweet20 likes
    Reply
     1
     
    Retweet
     1
     
     
    Like
     20
  3.  

    Bloomberg is highlighting ETF inflows, but without useful context. Article "Stock Investors Go `All-In' With $6 Billion Bet on S&P 500 ETFs" at https://www.bloomberg.com/news/articles/2019-07-15/stock-investors-go-all-in-with-6-billion-bet-on-s-p-500-etfs . It is not SPY which is driving this now. (1/3)

    D_i7wshXYAMlPdT.png
    7 replies7 retweets36 likes
    Reply
     7
     
    Retweet
     7
     
     
    Like
     36


#7 dTraderB

dTraderB

    Member

  • Traders-Talk User
  • 17,212 posts

Posted 16 July 2019 - 07:02 AM

Gone to GREED


https://money.cnn.co...fear-and-greed/


#8 dTraderB

dTraderB

    Member

  • Traders-Talk User
  • 17,212 posts

Posted 16 July 2019 - 07:03 AM

Still green.. fizzling, sputtering but could be a consolidation of the rally and then what????


https://www.marketin...llan-oscillator


#9 dTraderB

dTraderB

    Member

  • Traders-Talk User
  • 17,212 posts

Posted 16 July 2019 - 07:03 AM

  1. $SPX has just put together two non-overlapping win streaks of at least 5 days (each), only three days apart. The last time we had 2 streaks at least that long, that close to each other? Dec 2010. What happened after that? Up +8% over the next 4 months.

    16 replies11 retweets74 likes
    Reply
     16
     
    Retweet
     11
     
     
    Like
     74
  2.  

    YOUR CRAP-BUT-TRUE $SPX ALL TIME HIGH FACT O' THE DAY $SPX has set a new intra-day all time high in 3 of the past 4 sessions. Even with the bull run of 2019, that hadn't happened since the last week of August, 2018.


#10 dTraderB

dTraderB

    Member

  • Traders-Talk User
  • 17,212 posts

Posted 16 July 2019 - 07:05 AM

Could not help laughing out aloud! 

But, serious stuff, folks! 

I may buy a few GOOGLE CALLS.... or maybe not....so tempting


zerohedge @zerohedge
FollowFollow @zerohedge
More

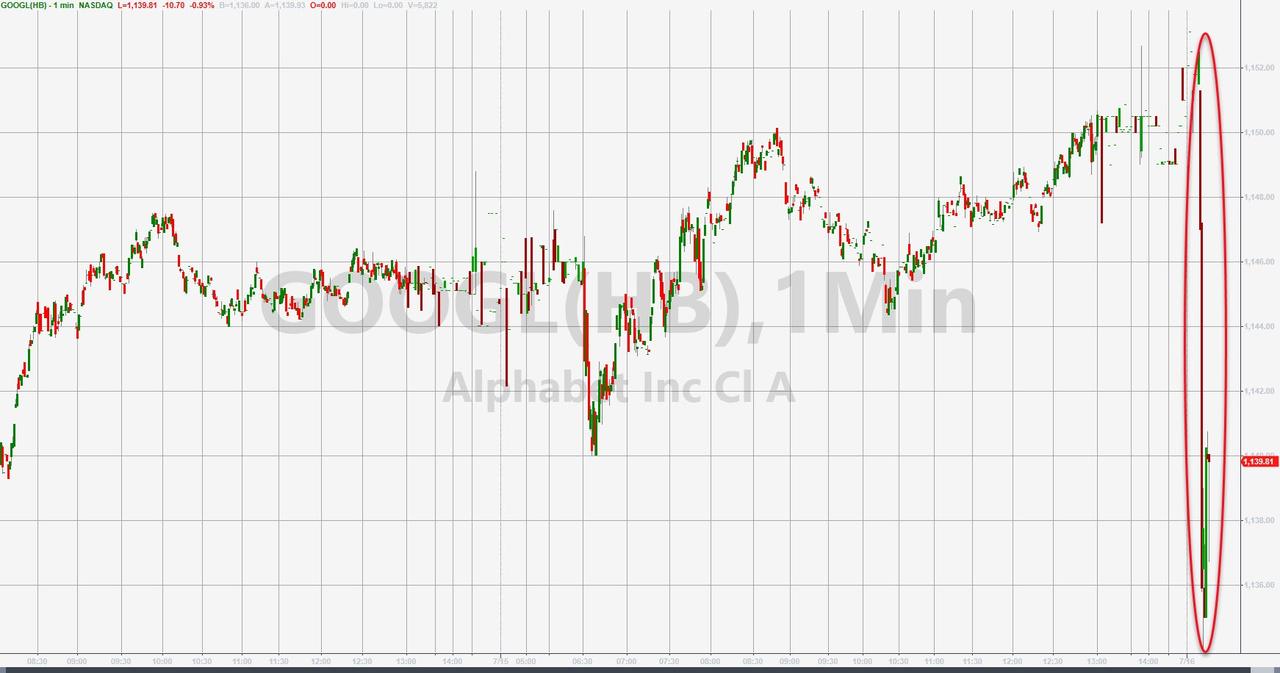
Google Shares Slide As Trump Agrees Company Should Be Investigated For Treason

2019-07-16.jpg?itok=NY05FwRW