
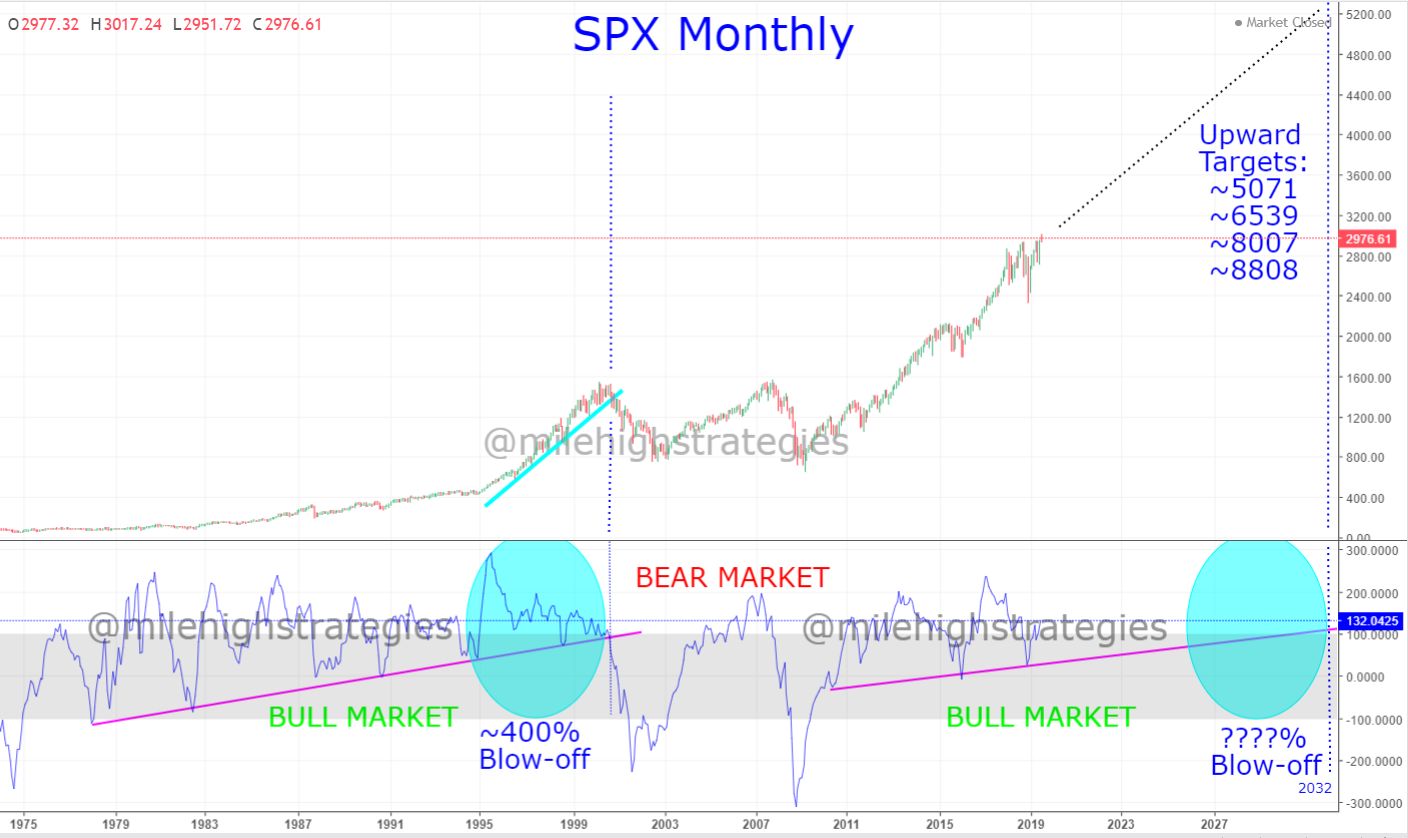
Here’s the SPX monthly chart with my methodology of defining bull markets and bear markets…
The previous bear market not shown was from 1966-1974, lasting 8-years…
The previous bull market before that was from 1942-1966, lasting 24-years…
The first bull market you see was from 1974-2000, lasting 26-years…
The last bear market was from 2000-2009, lasting 9-years…
My momentum indicator trend line presently projects the present bull market to continue until ~2032…
The lowest target I have for the final top is ~5100, though as you can see from the previous blow-off phase, which was a nearly 400% move from 1995-2000, that my ~8800 projection may still be too low – even from today’s price level… watching.
Edited by tsharp, 20 July 2019 - 05:15 PM.


