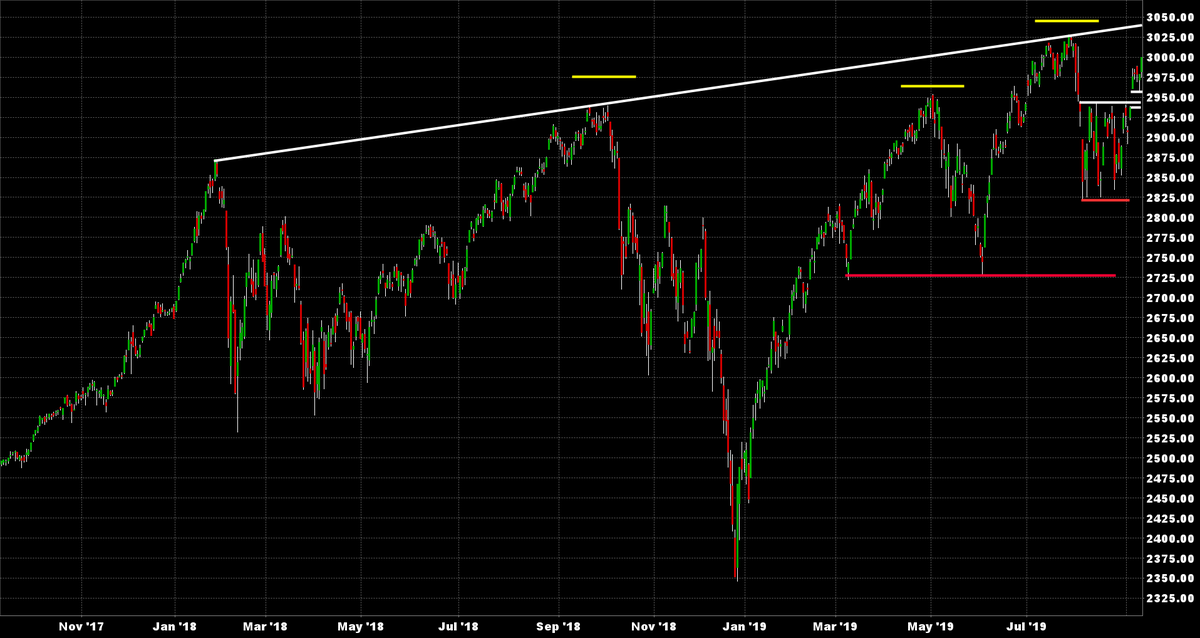
Ok. Let's step back. Here is the $SPX chart for the last 2 yrs. At the close today it was +4.4% since the 1/26/18 hi. 3 nominal new highs were made since then, each of which subsequently let to selloffs of varying degree, with signals when the prior high was broken. $NDX $IWM
6:59 PM - 11 Sep 2019
Edited by dTraderB, 12 September 2019 - 06:27 AM.