Jump to content


Photo

R2K topped literally over a year ago


  • Please log in to reply
22 replies to this topic

#11 robo

robo

    Member

  • Traders-Talk User
  • 1,217 posts

Posted 03 October 2019 - 09:01 AM

Waiting to see if the start of the rate cut cycle can save the day. I posted the LT data above....  In 2000 and 2008  it did not.....  I will be watching and trading my daily trend line data....up or down....the direction is up to Mr Market and I don't track the reasons I just trade the trend using the daily 10 DMA, and I do get whipsawed some. I have some other indicators I use at extremes that help for VST trades.... That's why I'm not short today.....  Sold my VXX and SDS yesterday. Me not greedy....  It looks like I should have stayed short, but that's ok.....


Thanks for posting the charts....


“There is only one side to the stock market; and it is not the bull side or the bear side, but the right side”   Jesse L. Livermore


#12 Waver

Waver

    Member

  • Traders-Talk User
  • 802 posts

Posted 03 October 2019 - 09:49 AM

FIB
That NYSE chart suggests a huge break out above the all time highs.
Have you ever seen such a long time divergence in price to such a great cumulative breadth?

#13 gismeu

gismeu

    Member

  • Traders-Talk User
  • 908 posts

Posted 03 October 2019 - 12:14 PM

FIB
That NYSE chart suggests a huge break out above the all time highs.
Have you ever seen such a long time divergence in price to such a great cumulative breadth?


Couldn’t it equally suggest a huge breakdown in cumulative breath?

Just wondering, gis
If you can't buy Happiness, STEAL IT!

#14 robo

robo

    Member

  • Traders-Talk User
  • 1,217 posts

Posted 03 October 2019 - 12:39 PM


FIB
That NYSE chart suggests a huge break out above the all time highs.
Have you ever seen such a long time divergence in price to such a great cumulative breadth?


Couldn’t it equally suggest a huge breakdown in cumulative breath?

Just wondering, gis


For me the simplicity of a simple 10 DMA for trading  on a daily chart means I never have to make guesses. However, I do track Seven Sentinels


and Sentiment trader, and I also use cycles.  But the bottom line is - For now the IWM index trend remains down and under its 10 DMA. All the reasons why don't really matter since I trade the trend in the end. Money to be made both ways ( up and down ) in the months ahead. LOL.... just wait until we get closer the the election and the polls indicate the them's are gaining on the Trumpster....  Some good swings coming our way!


https://stockcharts....527&a=690411574


Good Trading! 


Edited by robo, 03 October 2019 - 12:49 PM.

“There is only one side to the stock market; and it is not the bull side or the bear side, but the right side”   Jesse L. Livermore


#15 gismeu

gismeu

    Member

  • Traders-Talk User
  • 908 posts

Posted 03 October 2019 - 12:49 PM

FIB
That NYSE chart suggests a huge break out above the all time highs.
Have you ever seen such a long time divergence in price to such a great cumulative breadth?


Couldn’t it equally suggest a huge breakdown in cumulative breath?
Just wondering, gis
For me the simplicity of a simple 10 DMA for trading  on a daily chart means I never have to make guesses. However, I do track Seven Sentinels
 
and Sentiment trader, and I also use cycles.  But the bottom line is - For now the IWM trend remains down and under the 10 DMA, and all the reasons why don't really matter since I trade the trend in the end.
 
https://stockcharts....527&a=690411574
 
Good Trading!

What is the DMA please?
I guess a kind of moving average, but what does the D stand for?

Thanks, gis
If you can't buy Happiness, STEAL IT!

#16 robo

robo

    Member

  • Traders-Talk User
  • 1,217 posts

Posted 03 October 2019 - 01:01 PM


FIB
That NYSE chart suggests a huge break out above the all time highs.
Have you ever seen such a long time divergence in price to such a great cumulative breadth?


Couldn’t it equally suggest a huge breakdown in cumulative breath?
Just wondering, gis
For me the simplicity of a simple 10 DMA for trading  on a daily chart means I never have to make guesses. However, I do track Seven Sentinels
 
and Sentiment trader, and I also use cycles.  But the bottom line is - For now the IWM trend remains down and under the 10 DMA, and all the reasons why don't really matter since I trade the trend in the end.
 
https://stockcharts....527&a=690411574
 
Good Trading!

What is the DMA please?
I guess a kind of moving average, but what does the D stand for?

Thanks, gis


Sorry......  ( 10 day moving average = 10 DMA) I'm using the simple moving averages ( 10 day, 50 day, and 200 day)  It's the same data many cycle guys use. However, I'm trading the 10 DMA on the daily.


Example - Likes Money last free report.....


https://likesmoneycy...to-get-bullish/


Look at my daily chart below that I use for trading and it's the same..... Easy to back test....  Below I go to cash, and above I buy VXF.  No short trades permitted at Vanguard.  VST trading is much different. At Vanguard I'm currently trading GDXJ, XES, and VXF..... Above the 10 DMA - Long....  Below back to cash, and yes I get whipsawed, but I'm looking to try a catch the bigger trends and not lose money on the bigger ones down. I track and pay for a few paid services, but never take trades from them..... 


A nice oversold bounce in play..... We shall see how it plays out...


Good Trading!


https://stockcharts....527&a=690411574


The 2 I use for VST and ST trading.... Looking for extremes to trade....


G8HNyK4U_x96.jpg
 
Thursday 11:15: Daily LOLR STS Down Down Up 0/7 0/7 7/0 10-Min Sentinels BUY SIG


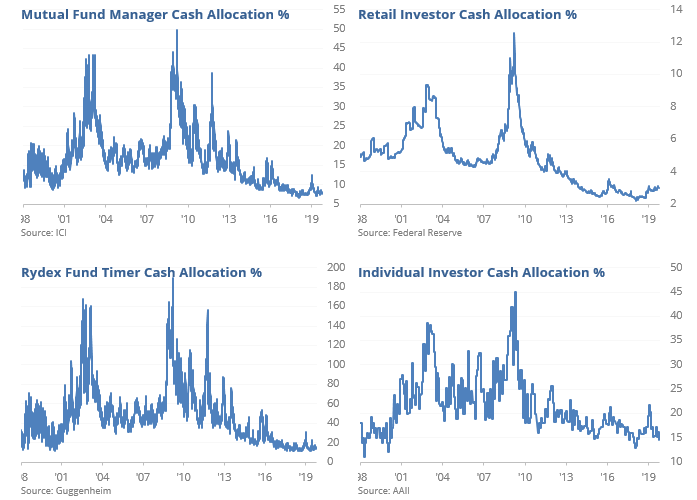
No cash cushion

In September, individual investors reduced their cash position to one of the lowest levels in 30 years. They’re not alone. Other groups of investors are also carrying a very low amount of cash relative to other assets.

20191003-140948_1570111786904.jpg


https://sentimentrad...st-in-30-years/


https://sentimentrader.com/blog/


Edited by robo, 03 October 2019 - 01:10 PM.

“There is only one side to the stock market; and it is not the bull side or the bear side, but the right side”   Jesse L. Livermore


#17 robo

robo

    Member

  • Traders-Talk User
  • 1,217 posts

Posted 03 October 2019 - 01:12 PM


FIB
That NYSE chart suggests a huge break out above the all time highs.
Have you ever seen such a long time divergence in price to such a great cumulative breadth?


Couldn’t it equally suggest a huge breakdown in cumulative breath?
Just wondering, gis
For me the simplicity of a simple 10 DMA for trading  on a daily chart means I never have to make guesses. However, I do track Seven Sentinels
 
and Sentiment trader, and I also use cycles.  But the bottom line is - For now the IWM trend remains down and under the 10 DMA, and all the reasons why don't really matter since I trade the trend in the end.
 
https://stockcharts....527&a=690411574
 
Good Trading!

What is the DMA please?
I guess a kind of moving average, but what does the D stand for?

Thanks, gis


Sorry......  ( 10 day moving average = 10 DMA) I'm using the simple moving averages ( 10 day, 50 day, and 200 day)  It's the same data many cycle guys use. However, I'm trading the 10 DMA on the daily.


Example - Likes Money last free report.....


https://likesmoneycy...to-get-bullish/


Look at my daily chart below that I use for trading and it's the same..... Easy to back test....  Below I go to cash, and above I buy VXF.  No short trades permitted at Vanguard.  VST trading is much different. At Vanguard I'm currently trading GDXJ, XES, and VXF..... Above the 10 DMA - Long....  Below back to cash, and yes I get whipsawed, but I'm looking to try a catch the bigger trends and not lose money on the bigger ones down. I track and pay for a few paid services, but never take trades from them..... 


A nice oversold bounce in play..... We shall see how it plays out...


Good Trading!


https://stockcharts....527&a=690411574


The 2 I use for VST and ST trading.... Looking for extremes to trade....


G8HNyK4U_x96.jpg
 
Thursday 11:15: Daily LOLR STS Down Down Up 0/7 0/7 7/0 10-Min Sentinels BUY SIG


No cash cushion

In September, individual investors reduced their cash position to one of the lowest levels in 30 years. They’re not alone. Other groups of investors are also carrying a very low amount of cash relative to other assets.

20191003-140948_1570111786904.jpg


https://sentimentrad...st-in-30-years/


https://sentimentrader.com/blog/


I use a 2 hour chart for VST, day trading, and ST trading.....  IWM trying to come back..... I don't care what the other indexes are doing or why unless I'm trading them....


Note: XES is on my chart and some nice VST trading with that index. Above Long below cash using the daily chart not the 2 hour. Plenty of whipsaws, but I'm trying to catch the bigger moves....


Have a nice day and I'm headed out to lunch.....


https://stockcharts....794&a=691046310


Edited by robo, 03 October 2019 - 01:17 PM.

“There is only one side to the stock market; and it is not the bull side or the bear side, but the right side”   Jesse L. Livermore


#18 gismeu

gismeu

    Member

  • Traders-Talk User
  • 908 posts

Posted 03 October 2019 - 01:36 PM

Thanks heaps for that!

Gis
If you can't buy Happiness, STEAL IT!

#19 robo

robo

    Member

  • Traders-Talk User
  • 1,217 posts

Posted 03 October 2019 - 02:56 PM

Thanks heaps for that!

Gis

You are welcome!   That system is not very useful to investors, but it works well for me as a trader that is trying to catch the bigger moves up, and go to cash on the moves down. Some thoughts on trend trading from a Pro....


I have some pretty good tools that give me some very good odds on how to VST trade, but overall I agree with the comment below and that's how I trade my Vanguard account.


Bottom Line - Ignore the news. Ignore the daily ups and downs. You have no control over them anyway. No one knows what the next day will bring. No one!


Trading Trends; Only for Winners

Barraged With News

Market timers following trends generate great returns over time because their buy and sell decisions are based on the one piece of information that counts the most. That information is "price."

We are barraged with fundamental analysis, price earnings ratios, economic projections, news events, and a steady stream of TV and news analysts who tell us where they think the market is going.

But the simple truth is... no one knows where the market is going next.

The only absolute truth... is price. If prices are trending higher, the market is going higher. If prices are trending lower, then the market is trending lower.

Two Kinds Of Traders

News events in particular cause traders to make incorrect decisions, because they play on emotions. The urge to follow the crowd is normal. It is comforting. And in a strong bull market, it may just be correct.

But in most circumstances, letting emotions push you into making trading decisions costs traders money.

"...price... the one thing that is guaranteed to make you a successful market timer or trader."


There are two kinds of traders.

1. Those who make emotional decisions based on any of the above.

2. Those who make money off of those who make emotional decisions.


Price Is Always Right

It is hard to accept that one aspect of the markets, price, could be the one thing that is guaranteed to make you a successful market timer or trader.

There are so many indicators, so much available analysis, but "price" is always right. It is "never" wrong. At the end of every trading day, price contains the input of millions of traders, the input of all technical and fundamental analysis.

Look at the 80% decline in the Nasdaq in the 2000-2002 bear market? Or the 50% decline in the 2008-2009 bear market? The losses were all over the financial press. But were the gains on the other side of those losses mentioned. Our Bull & Bear Timer was up over 120% during those bear markets.

Losses are news, gains apparently are not.

Market timers following price trends profited during these declines. They were windfalls. But you will never read about it in the press.

Following Price

Price is objective. You can faithfully follow prices and make timing decisions based on them. You are able to determine trend changes, and most importantly, to exit those positions if the trend was a false one.

"...when the trends take off, the profits are made."
And false trends do occur. Usually at market tops and market bottoms. But the losses in "trendless" markets are kept small by those who use "price" to establish trading strategies and risk management trading rules.

And when the trends do take off, the profits are made.

Market analysis is always subjective. It can not be trusted in trading decisions. Indicators work some of the time, but also can fail miserably. The financial news media is not even worth mentioning.

Only price can be trusted. Only price is always right. Only using price to determine trends can lead you to profitable timing and a successful investing future.

Conclusion

Market timers must follow the trading strategies faithfully. Every sell signal must be followed immediately, and every buy signal as well.

Guessing how far a trend will go is useless. No one knows. Price makes the trend.

Discipline is the name of this game. Those who stand the test of time and make the trades, will over time, beat the markets, and will be investing winners.


Recent articles from the Fibtimer market timing services;

https://www.fibtimer...ommentaries.asp


Edited by robo, 03 October 2019 - 03:04 PM.

“There is only one side to the stock market; and it is not the bull side or the bear side, but the right side”   Jesse L. Livermore


#20 robo

robo

    Member

  • Traders-Talk User
  • 1,217 posts

Posted 03 October 2019 - 03:07 PM


G8HNyK4U_x96.jpg


SERIOUS Traders Only We Have now Opened from Tuesday Oct 1: Moment of Truth II - https://sevensentinels.com/moment-of-truth-ii/ One more that explains the critical concept of aligning with the Line Of Least Resistance: https://sevensentinels.com/quantifying-the-line-of-least-resistance/


https://sevensentine...nt-of-truth-ii/


Edited by robo, 03 October 2019 - 03:07 PM.

“There is only one side to the stock market; and it is not the bull side or the bear side, but the right side”   Jesse L. Livermore