
On January 4, 2019, just after the SPX had fallen some 600-points, from the September 2018 highs of ~2950 to the December 2018 lows of ~2350, I forecast the SPX to push back upward to new all-time-highs (ATHs) within months - not years, if ever - as so many in the forecasting world were suggesting... and on 4.26.19, the SP500 fulfilled that forecast, setting a new all-time closing high…
On February 15, 2019, eleven months ago next week, even before my previous forecast had come to fruition, I could see the writing on the wall, and revised my forecast to include the SP500 pushing upward into year's end, with a target of ~3290...
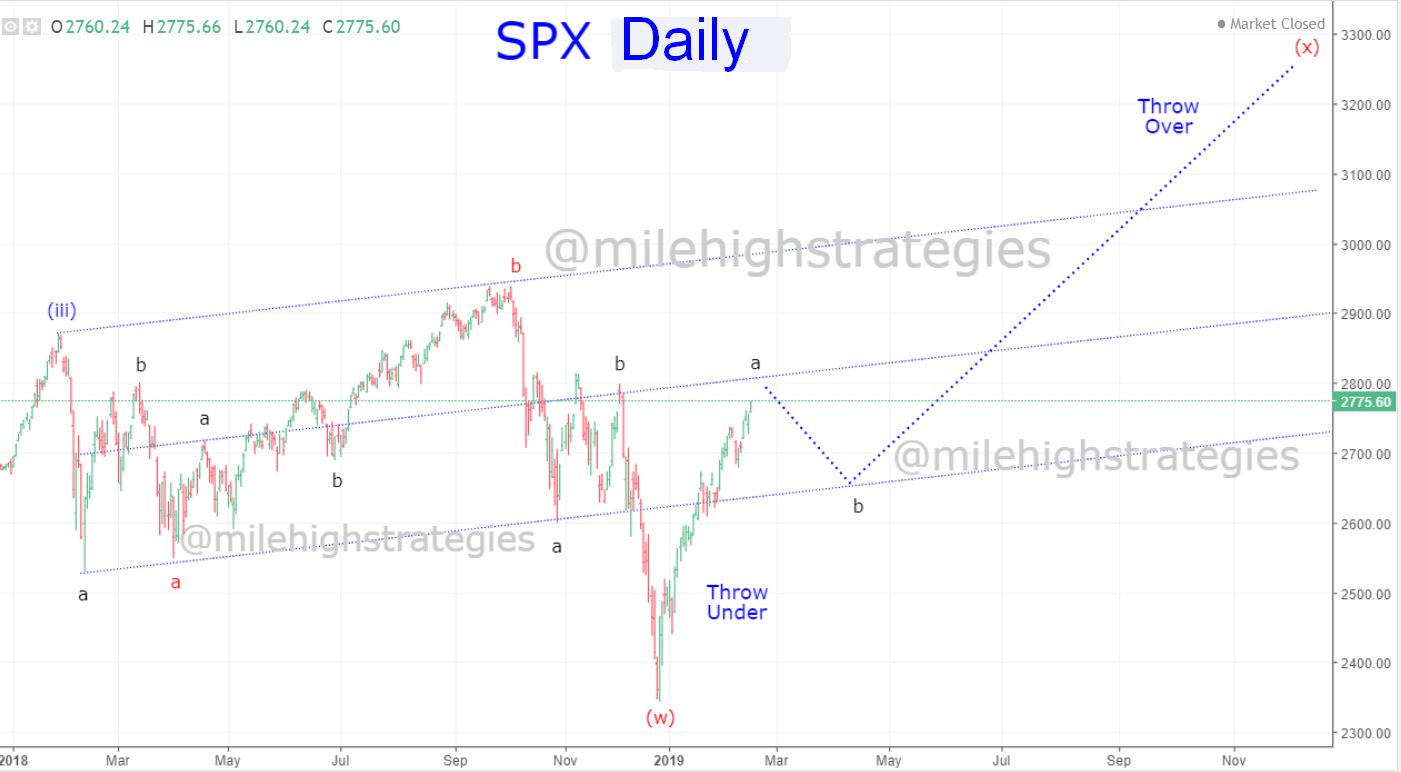
Yesterday, 1.10.20, the SP500 hit an intraday peak of ~3283, coming only 7-points or .21% short of my target. And while we should see one more upward push next week as President Trump signs the Phase-1 Trade Agreement with China, and my target may be reached or even slightly exceeded, I would call this forecast fulfilled.

What's next for the US equities markets, and the SP500 in particular? 2020 promises to be a year of challenge, as wave-y:2 takes back a good portion of 2019's gains... watching.


