Got my 9840.....if bears are still in biz that should be about it...

hedges out possible www high
Started by
da_cheif
, Jun 10 2020 06:04 PM
99 replies to this topic
#91

K Wave
-

- Traders-Talk User
- 26,514 posts
Member
Posted 12 June 2020 - 09:03 AM
The strength of Government lies in the people's ignorance, and the Government knows this, and will therefore always oppose true enlightenment. - Leo Tolstoy
#92
da_cheif
-
- Traders-Talk User
- 10,960 posts
Member
Posted 12 June 2020 - 10:29 AM
10 day clx vulnerable till post opex monday
#93
pdx5
-

- Traders-Talk User
- 9,527 posts
I want return OF my money more than return ON my money
Posted 12 June 2020 - 03:48 PM
My VST Buy signals are still working out. That suggest that this is just corrective (overdue, at that).
M
This correction was healthy for the market. Sharp corrections are a hallmark of bull markets, and blistering rallies are a bear market feature.
"Money cannot consistently be made trading every day or every week during the year." ~ Jesse Livermore Trading Rule
#94
da_cheif
-
- Traders-Talk User
- 10,960 posts
Member
Posted 12 June 2020 - 09:22 PM
10 day clx vulnerable till post opex monday
doesnt mean we cant go up from here but after mon post opex the clx stuff will provide wind
Edited by da_cheif, 12 June 2020 - 09:22 PM.
#95
K Wave
-
- Traders-Talk User
- 26,514 posts
Member
Posted 13 June 2020 - 12:36 PM
10 day clx vulnerable till post opex monday
doesnt mean we cant go up from here but after mon post opex the clx stuff will provide wind
Yep if bulls can't gain any traction over next couple of days, then perhaps the old Shake and Bake
Quick drop to Dow 23,700, and then engage the slingshot....
could look something like this on 15, 30 min charts
15 min shakeout below 900
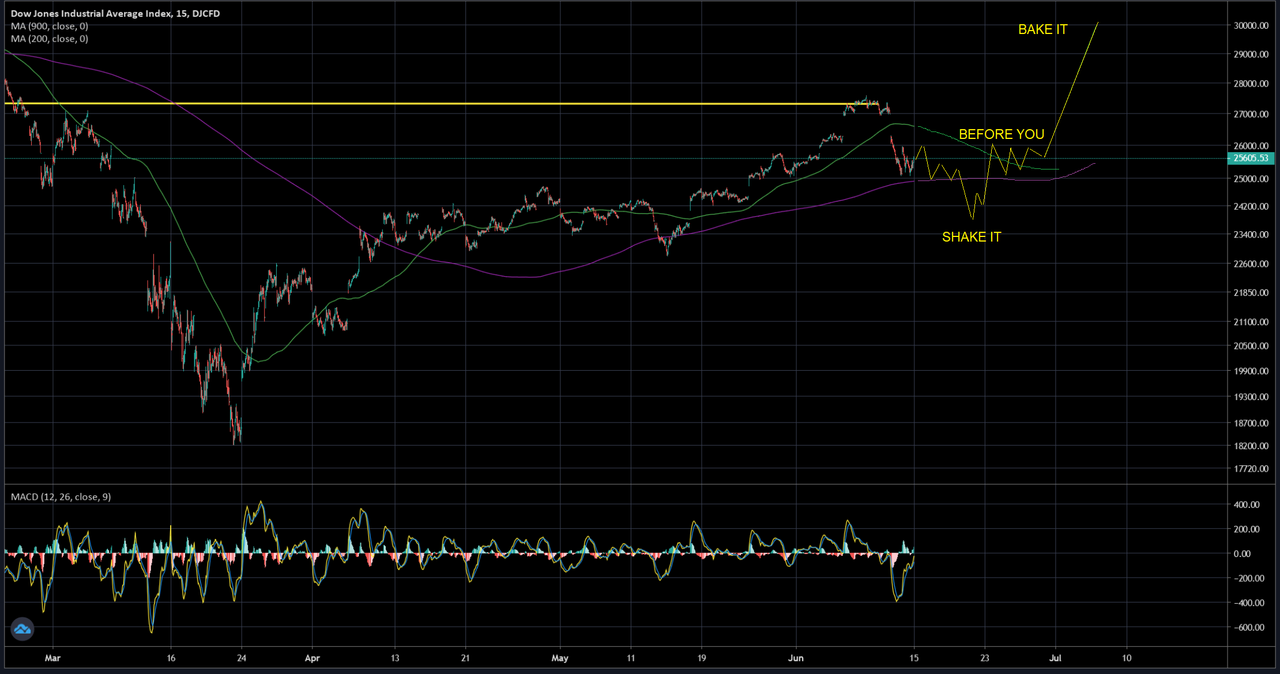
while 30 min provides support

The strength of Government lies in the people's ignorance, and the Government knows this, and will therefore always oppose true enlightenment. - Leo Tolstoy
#96
Darris
-

- Traders-Talk User
- 1,667 posts
Member
Posted 13 June 2020 - 03:30 PM
How about the VIX drop of nearly 20% in the last two hours Friday? 44+ to below 36 !!! Here is a close up of the CBOE put/call ratio/VIX combo FEAR Ranked %. This indicator implies those metrics are back to fully Bearish again. Note the summary table of last 3 bottoms around 3% or less last two months. Fast moves. 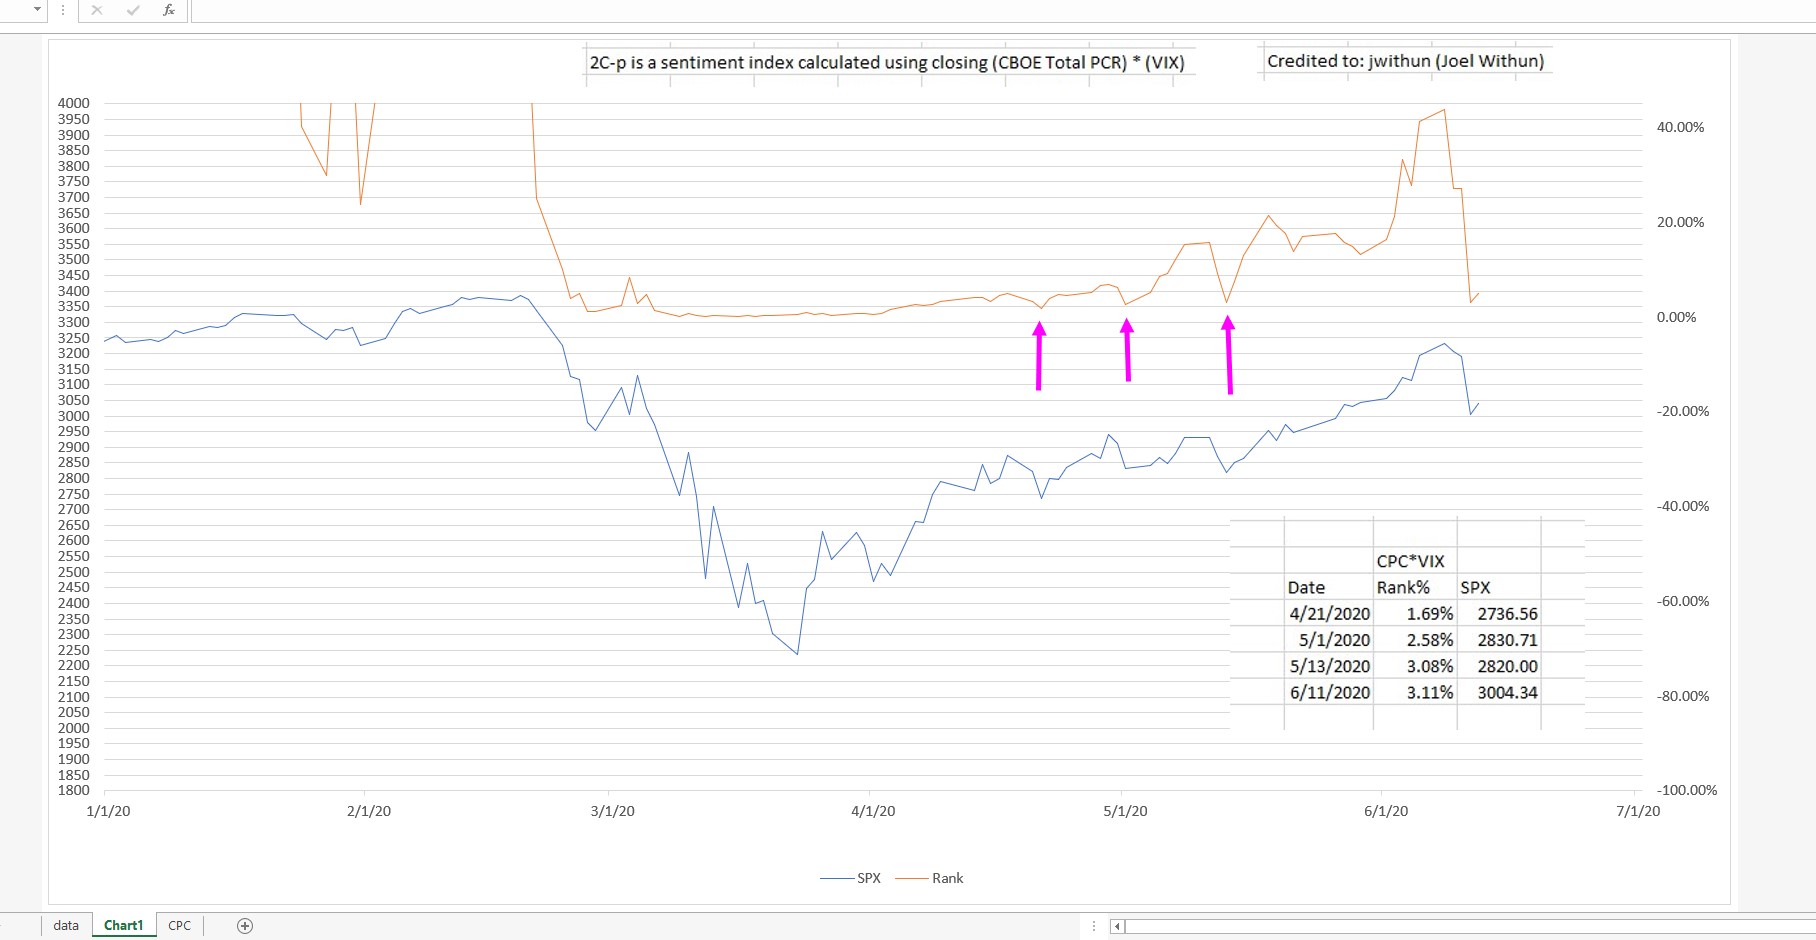
#97
Russ
-

- Traders-Talk User
- 7,193 posts
Member
Posted 14 June 2020 - 06:48 PM
How about the VIX drop of nearly 20% in the last two hours Friday? 44+ to below 36 !!! Here is a close up of the CBOE put/call ratio/VIX combo FEAR Ranked %. This indicator implies those metrics are back to fully Bearish again. Note the summary table of last 3 bottoms around 3% or less last two months. Fast moves.
What is your approx. target price for spx over the coming few weeks?
"Nulla tenaci invia est via" - Latin for "For the tenacious, no road is impossible".
"In order to master the markets, you must first master yourself" ... JP Morgan
"Most people lose money because they cannot admit they are wrong"... Martin Armstrong
http://marketvisions.blogspot.com/
"In order to master the markets, you must first master yourself" ... JP Morgan
"Most people lose money because they cannot admit they are wrong"... Martin Armstrong
http://marketvisions.blogspot.com/
#98
Darris
-
- Traders-Talk User
- 1,667 posts
Member
Posted 14 June 2020 - 07:18 PM
I'm an indicator guy in terms of buying OS and selling OB. The only ES target I would have for the upcoming Quad Witch Expiration is something north of ES June 3200 early Friday morning before the cash opens. ES June last trade is at 9:29:59 am Friday morning. Thursday before expiration is the Roll over start, so it was a rough one this Quad, but there are plenty of examples of rough roll overs having sharp rips back up into the actual expiration. The FEAR meter posted above suggests we rapidly dropped back into a buy on Thursday close in only 3 days. In the summary table shown above, each one of those lows were produced in 2-4 days of trading from the prior peak, so June 11th fits the pattern perfectly, so far.
#99
Russ
-
- Traders-Talk User
- 7,193 posts
Member
Posted 14 June 2020 - 08:31 PM
I'm an indicator guy in terms of buying OS and selling OB. The only ES target I would have for the upcoming Quad Witch Expiration is something north of ES June 3200 early Friday morning before the cash opens. ES June last trade is at 9:29:59 am Friday morning. Thursday before expiration is the Roll over start, so it was a rough one this Quad, but there are plenty of examples of rough roll overs having sharp rips back up into the actual expiration. The FEAR meter posted above suggests we rapidly dropped back into a buy on Thursday close in only 3 days. In the summary table shown above, each one of those lows were produced in 2-4 days of trading from the prior peak, so June 11th fits the pattern perfectly, so far.
I see the final low coming in late june. This video agrees with you that a bounce up is coming but it will collapse and bottom into the July time period, he is using lots of cycles... https://www.youtube....h?v=SVL4GtBH2Hw
"Nulla tenaci invia est via" - Latin for "For the tenacious, no road is impossible".
"In order to master the markets, you must first master yourself" ... JP Morgan
"Most people lose money because they cannot admit they are wrong"... Martin Armstrong
http://marketvisions.blogspot.com/
"In order to master the markets, you must first master yourself" ... JP Morgan
"Most people lose money because they cannot admit they are wrong"... Martin Armstrong
http://marketvisions.blogspot.com/
#100
Darris
-
- Traders-Talk User
- 1,667 posts
Member
Posted 19 June 2020 - 09:33 AM
I'm an indicator guy in terms of buying OS and selling OB. The only ES target I would have for the upcoming Quad Witch Expiration is something north of ES June 3200 early Friday morning before the cash opens. ES June last trade is at 9:29:59 am Friday morning. Thursday before expiration is the Roll over start, so it was a rough one this Quad, but there are plenty of examples of rough roll overs having sharp rips back up into the actual expiration. The FEAR meter posted above suggests we rapidly dropped back into a buy on Thursday close in only 3 days. In the summary table shown above, each one of those lows were produced in 2-4 days of trading from the prior peak, so June 11th fits the pattern perfectly, so far.
June ES 2020 goes out on top tick for the session at 3196 and 50 pts above where Sept was trading at the open. Chart here. https://twitter.com/...982635535208455


