I respect all opinions on this board on trading and virus, and think this is a great board.

opinions on trading and virus
Started by
traderx
, Jul 05 2020 07:15 PM
9 replies to this topic
#2

OEXCHAOS
-

- Admin
- 22,019 posts
Mark S. Young
Posted 06 July 2020 - 08:27 AM
There are a bunch of smart folks on here. Some of us are a bit prickly, but many of us have known each other for 25 years, maybe longer. TT is 20 years old last month!
Mark
Mark S Young
Wall Street Sentiment
Get a free trial here:
http://wallstreetsen...t.com/trial.htm
You can now follow me on twitter
#3
pdx5
-

- Traders-Talk User
- 9,527 posts
I want return OF my money more than return ON my money
Posted 06 July 2020 - 08:51 AM
There are a bunch of smart folks on here. Some of us are a bit prickly, but many of us have known each other for 25 years, maybe longer. TT is 20 years old last month!
Mark
Thanks Mark for making me realize how old I am LOL
But I agree there are some very smart traders here.
"Money cannot consistently be made trading every day or every week during the year." ~ Jesse Livermore Trading Rule
#4
OEXCHAOS
-
- Admin
- 22,019 posts
Mark S. Young
Posted 06 July 2020 - 12:54 PM
Anybody reading remember Fearless Forecasters on AOL?
Mark S Young
Wall Street Sentiment
Get a free trial here:
http://wallstreetsen...t.com/trial.htm
You can now follow me on twitter
#5
Darris
-

- Traders-Talk User
- 1,667 posts
Member
Posted 06 July 2020 - 01:09 PM
In the early days, I remember Porter sharing a lot of his systems. Can not remember the AOL TT. I was looking over Porter's Weekly Breadth Momentum indicator this weekend, LOL. I think he talked about Alligator and maybe Turtle systems sometimes.
#6
OEXCHAOS
-
- Admin
- 22,019 posts
Mark S. Young
Posted 06 July 2020 - 05:29 PM
In the early days, I remember Porter sharing a lot of his systems. Can not remember the AOL TT. I was looking over Porter's Weekly Breadth Momentum indicator this weekend, LOL. I think he talked about Alligator and maybe Turtle systems sometimes.
I was sad to lose him.
Mark S Young
Wall Street Sentiment
Get a free trial here:
http://wallstreetsen...t.com/trial.htm
You can now follow me on twitter
#7
salam
-

- Traders-Talk User
- 1,579 posts
Member
Posted 06 July 2020 - 09:01 PM
I joined just after AOL....20 years. Wow!
before that, I was running my own forum for UK traders interested in US markets
I remember Porter, Emini, Index Trader etc.
Edited by salam, 06 July 2020 - 09:04 PM.
I'm not sure what my future holds... But I know who holds it.
#8
sixpack
-

- Traders-Talk User
- 62 posts
Member
Posted 06 July 2020 - 10:13 PM
I seem to remember a great many of us were hanging out in the bear message board on aol before the TT board. That was about 25 years ago. Lots of good traders back then and consistently through the years. Mark has always managed to attract quality traders.
#9
Darris
-
- Traders-Talk User
- 1,667 posts
Member
Posted 06 July 2020 - 10:49 PM
Here is one from WhichWayGo circa summer 2003:
--------------------------------------------------------------------------
MCO bottoming action? (chart)
Posted By: WhichWayGo
Date: Sunday, 10 August 2003 at 11:19 p.m.
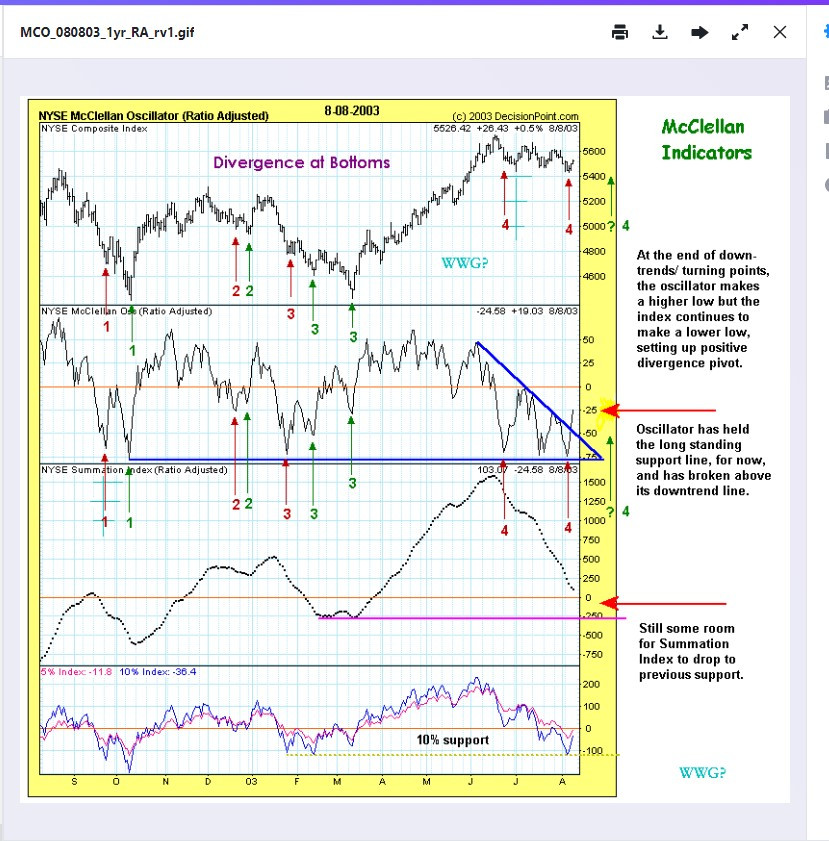
Bottom Line:
While the upbreak of late last week of the two-month downtrend pattern of a series of lower highs on the oscillator is positive, and portends an early signal of an upcoming near-term trend change to up in the market, if past oscillator patterns repeat (considering the three prior examples noted on the chart just in the past 12 month period), we should be on the lookout for the definite possibility of one more “ lower low” in the indices over the next 2 – 3 weeks as part of the final stages of the “complex bottoming” process. This would set up yet another “positive divergence” scenario prelude to the confirmed new uptrend of the indices commencing a new “positive cycle” on the oscillator above its zero line, likely expected to transpire over 4-5 weeks, unless extended or aborted.
In my McClellan update of this past Tuesday, August 5, I drew the lines and pointed out the potential declining wedge pattern unfolding in the oscillator. This, coming at the end of a mature “negative cycle” on the oscillator approaching seven weeks, with a “normal” cycle being 4 to 5 weeks.
On Wednesday, August 6, following end of trading I gave the update:
“On opening [Wednesday] the net –600 A/D issues caused the oscillator to overshoot the lower boundary of the declining wedge and lower support level intraday. But by the end of the day the net A/D was even, causing the oscillator to turn up slightly from Tuesday’s reading, [right at the support line]. Thus, the market is holding support so far, and is still contained in the apparent declining wedge pattern.”
With the subsequent market action of last Thursday and Friday, the short-term positive trend continued such that the oscillator has now broken above its declining tops line, which actually began with the momentum peak of June 6. The oscillator reading had improved to –25 on Friday (basis the “ratio adjusted” chart). With this coming week going on the eighth consecutive negative week for the oscillator, it appears as though it wants to head back to its zero line.
While the oscillator action is a positive development, the nature of the “complex bottoming” action can be tricky, such that it is still possible to see a lower low on the indices in the coming 1-3 weeks. This view is based on the observation of a “positive divergence” set-up coinciding with many cycle low turning points on the oscillator vs. the index price. This action is identified on the above chart to have occurred three times just in the past one year timeframe depicted by the chart; two at medium-term lows and one at a minor low.
Example-1:
Start with the first major (medium-term) low turning point from late September to early October, 2002. You can see from the brown arrows #1, the oscillator reached an oversold reading on about 9/24/02 with SPX closing at 819.29. That was followed by five days upward/ less negative oscillator readings, culminating in a one-day “positive” close for the oscillator on 10/10/02 (SPX closing of 847.91). This was immediately followed by six down days on the oscillator, to a just slightly greater negative reading on 10/09/02 of about -75 (essentially a double bottom), shown by the green arrows #1.
However, the SPX index made a notable lower price on the second oscillator “retest” on 10/09/02, closing at 776.76, or 42.5 pts. (5.2%) lower than 9/24/02. The intraday low of SPX 768.63 on 10/10/02 was some 50.6 pts. (6.2%) lower. This “positive divergence” set-up the lowest low and significant upturn point of the past year, and still holding.
Example-2:
The next example of “divergence at bottoms” is marked by brown arrows #2 on the chart. This ended up being only a “minor” bottom/ upturn point, in context of a near-term downtrend from the Dec. 2002 highs, but the divergence action still occurred.
The oscillator low reading was about –25 on 12/19/02, with SPX closing at 884.25. This was followed by several days of upward/ less negative oscillator readings, culminating again in a one-day “positive” close for the oscillator on 12/24/02. The next trading day, 12/26/02, SPX achieved a higher intraday level of 903.89 then quickly reversed down on both the oscillator and index, leading to the index low for this minor correction of 873.62 closing on 12/27/02 (intraday low of 869.45 on 12/31/02).
Note that at the second minor low marked with green arrows #2, the oscillator made a somewhat higher low (less negative reading) while the index made a lower low, some 10.63 pts. (1.2%) on a closing basis, or 14.8 pts. (1.7%) on an intraday basis. This minor “positive divergence” set-up lead to a strong but brief, 2-week minor rally into January of some 65 SPX points, or +7.5%.
Example-3:
Finally, the last major “medium-term” low cycle on the oscillator occurred at the first part of 2003. While the actual closing price low for the indices was made on March 11 with SPX closing at 800.73, with a lower intraday low of 788.90 the next day on March 12 (see the second green arrow #3). However, the oscillator action was signaling a potential “complex bottoming” process over several weeks prior to these index lows.
See the brown arrows #3. The oscillator made a quick initial low in oversold territory to close at about –75 on 1/27/03, with an SPX intraday low of 844.25. Over the next week the oscillator rallied back to “shallow” oversold territory about –15, where the oscillator stalled and turned back down over the next 8 trading days to establish its first “higher low” at around –52 on 2/13/03.
This first “higher low” on the oscillator coincided with a lower low on the indices, with SPX closing at 817.37 and intraday low of 806.30, some 37.9 SPX points (4.5%) lower than the actual oscillator low for that cycle some 13 trading days earlier.
Here is where the market “threw in a curve ball”. While the low on 2/13/03 satisfied a “positive divergence” set-up, as described above, and considering the oscillator had been negative for some 4-1/2 weeks at the 2/13/03 low (a “normal” cycle), and some 6 weeks in declining cycle from the last oscillator momentum peak on January 6, it would have been certainly reasonable to conclude that this “negative cycle” in the oscillator was now finished and a new positive cycle/ uptrend was confirmed.
Instead, the oscillator rallied for two weeks/ 10 trading days to a “shallow” positive reading about +22, with the SPX achieving a corresponding rally high back to 852.34 on 3/03/03. The oscillator “failed” on its first rally attempt above its zero line following a “full” negative cycle, failing to “gap up” into the higher ranges of positive territory and then failing to hold above zero.
Thus, this “first positive attempt failure” caused the oscillator to decline for seven trading days to another negative reading of about –27 on 3/11/03 (see the second green arrow #3). This ended up being the low point for the indices for that oscillator decline cycle, even though the –27 oscillator reading was actually a “second higher low” in that bottoming process.
This not-so-common “second higher low” positive divergence complex bottom sequence set up a powerful start to a new oscillator positive cycle, with a “kickoff” move to a “robust” +50 or so reading on the oscillator, coinciding with a strong +13.5% gain in the SPX index over just 8 trading days from 3/11/03.
What now?
In the current corrective cycle, labeled as brown arrows #4 on the chart, the oscillator achieved an initial “oversold” reading of about -70 on June 23. This turned out to be well early in the current corrective cycle. SPX reached an intraday low of 977.40 on this day, down from the most recent high of 1015.33 on June 17, only one week earlier.
The current oscillator downcycle has extended to its maximum duration in terms of time, and has also turned into a complex corrective pattern, adding to the inference that this cycle low will be of some significance more than “minor” degree, more along the lines of the last two near-term cycle lows exhibited on the McClellan one-year chart and described above by arrows #1 and #3.
In the current corrective cycle, the oscillator rallied up from its initial oversold spike of June 23, but still maintained negative readings, not quite reaching the zero line. It then turned down again to close near –75 on July 17 and again July 21, the second low corresponding to an SPX intraday low print of 975.63.
The oscillator rebounded yet again, but this time making a lower negative reading around –25 before turning back down, to yet a third, slightly lower low reading for this cycle of –75 last Tuesday, August 5. SPX closed at 965.46, with a slightly lower intraday reading the next day, Wednesday, August 6 at SPX 960.84.
The past three trading days the oscillator has turned up sharply from this nearly 6-1/2 week “triple bottom” to finally break above its clear declining downtrend line of eight weeks, which began with the last oscillator momentum peak on June 6 when SPX reached an intraday high of 1007.7.
See “bottom line” above.
10% Index:
Finally, note the “10% index” at the bottom of the MC chart. This is one of the advance/ decline derivative moving averages that make up the daily oscillator reading, derived from the raw advance/ decline data. Note that at its low last Tuesday, August 5 (closing basis) the “10% index” achieved a “retest” of strong support at a negative level equal to the previous medium-term low cycle earlier this year.
Note that the “10% index” often “leads” the oscillator, and the oscillator “leads” the summation index. Note back at the previous lows, the 10% index made a “double bottom” low, at current levels, between the January 27 and February 13 lows. It pays to “keep on eye” on the 10% index as well in the current cycle for additional clues to the market action.
WWG