This from link in post above:
Bulls Charge To All-Time Highs
As discussed previously in “Insanely Stupid,” we noted the market remained confined to its consolidation channel, but the bullish bias was to the upside.
“While the market has not been able to push above the recent July highs, support is holding at the rising bullish trend line. With the short-term ‘buy signals’ back in play, the bias at the moment is to the upside.
However, as we have discussed over the last couple of weeks, July held to its historical trends of strength. With a bulk of the S&P 500 earnings season behind us, we suspect the weakening economic data will begin to weigh sentiment in August and September.“
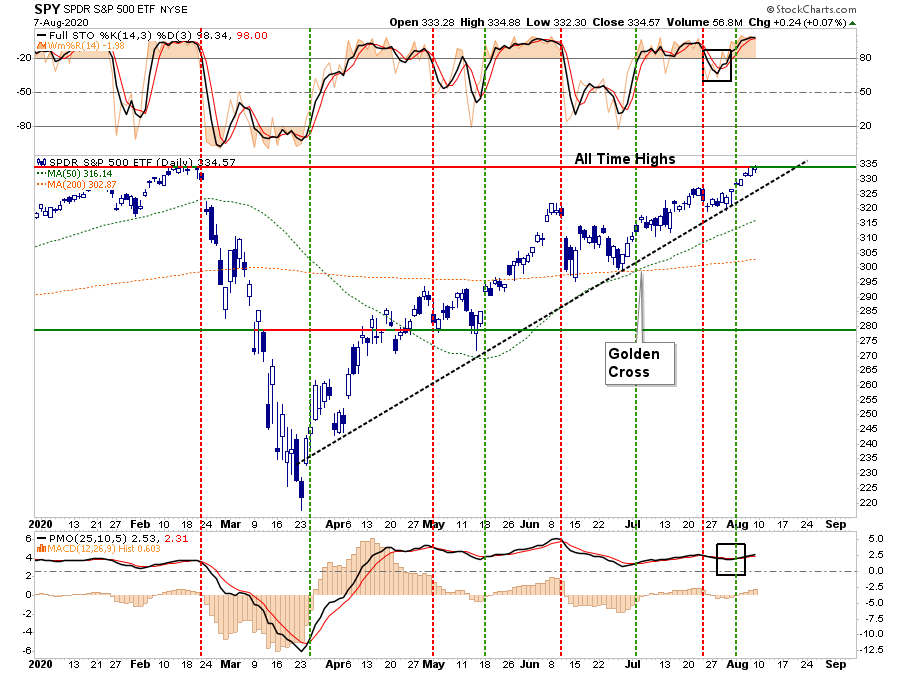
While weaker economic data has not yet dented the “bullish sentiment” at this juncture, it doesn’t mean it won’t. However, as we have discussed over the last several weeks, a breakout of the consolidation range, which was capped by the June highs, would put all-time highs into focus.
A Weighted Distortion
The concern is that what you see with the market, is not necessarily what you get. The chart below shows the number of stocks trading above the 200-dma versus the S&P 500 trading above its 200-dma.
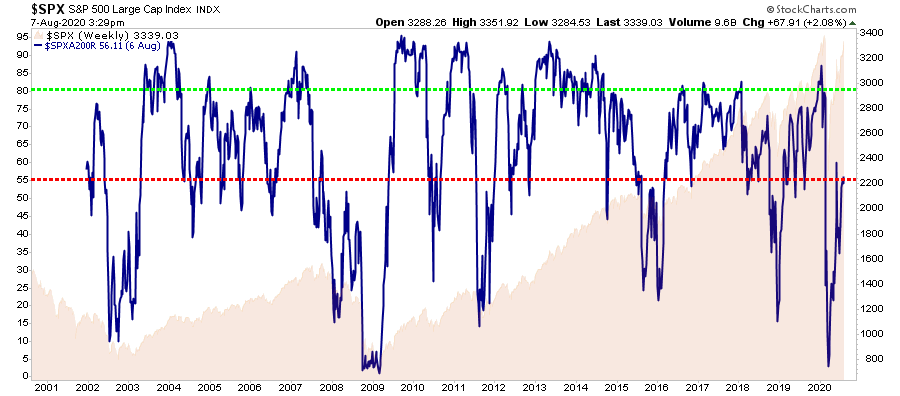
In theory, if the “market” is above its 200-dma, then a large number of stocks, usually about 80%, should also be. However, such is not the case, as only 55% currently do so.
The market is currently being driven to new highs by the “chase” into the largest mega-capitalization stocks. Sentiment Trader noted this on Friday:
“The biggest stock in the U.S. and nearly the world, Apple, keeps powering higher. At the end of June, the value of Apple alone was nearly 80% of the Russell 2000 index’s market capitalization. As of today, it’s nearly 90%. This is astounding – in the past 40 years, no single stock has come close to dwarfing the value of so many other companies.“
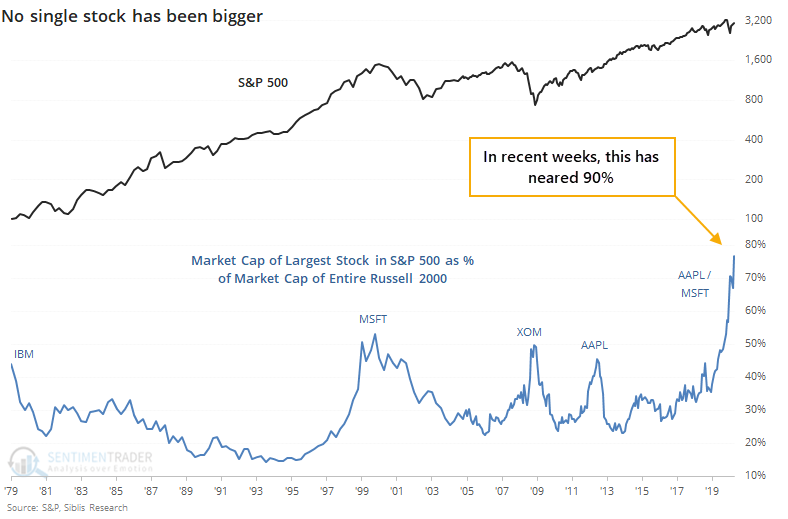
By itself, this data point does not have a lot of historical relevance. However, it does tend to be more of an indication of underlying “exuberance” in the market.
The point here, however, is the top-5 stocks are distorting the overall market participation.