Jump to content


Photo

IT LONG TREND INTACT - Top this week


  • Please log in to reply
144 replies to this topic

#11 dTraderB

dTraderB

    Member

  • Traders-Talk User
  • 17,282 posts

Posted 16 August 2020 - 07:56 AM

I am watching this... only watching, so far, but anyone trading GOLD & SILVER? who is the best on this in Twitter or anywhere?


Gold & silver remain in robust rallies. Sharp runups lead to short,sharp corrections & that's just what we just had. I expect the steep rally to resume here. My targets remain $2300 for gold & $35 for silver.


#12 dTraderB

dTraderB

    Member

  • Traders-Talk User
  • 17,282 posts

Posted 16 August 2020 - 07:59 AM

Same as GOLD & SILVER: only watching


$tsla will prove out to be an easy trade for next week with PT of 1700+ Elliot wave zig zag pattern closed above the supply level stock split #BULLISH #Battery #China
7:10 PM · Aug 15, 2020·Twitter Web App


#13 dTraderB

dTraderB

    Member

  • Traders-Talk User
  • 17,282 posts

Posted 16 August 2020 - 08:02 AM

n this issue of, “Close But No Cigar, Bulls Fail To Capture Market Highs”

  • Close But No Cigar
  • The Coming Income Cliff
  • Hedging Risk
  • MacroView: Why Soros Just Called The Market A Bubble
  • Sector & Market Analysis
  • 401k Plan Manager

https://realinvestme...highs-08-14-20/


#14 dTraderB

dTraderB

    Member

  • Traders-Talk User
  • 17,282 posts

Posted 16 August 2020 - 08:04 AM

At link above:

SP500-Chart2-081420.png

This week, despite repeated attempts, the bulls were unable to close above all-time highs solidly. As they say, “it was close, but no cigar.”

With options expiring next week, the bulls are going to attempt to push markets up. A breakout to all-time highs is entirely possible. However, the question is whether they will be able to maintain it?


#15 dTraderB

dTraderB

    Member

  • Traders-Talk User
  • 17,282 posts

Posted 16 August 2020 - 08:04 AM

ar link above:


A Normal Correction Is Likely

With the markets overbought on several measures, there is a downside risk heading into the end of the month. These risks come from several fronts we will discuss momentarily. However, from a technical perspective, the downside risk is about 5.6% to the 50-dma and 9.4% to the 200-dma. (Shown above)

A 5-10% decline in any given year is not outside of the norm. However, since investors have entirely forgotten what a drop feels like, a 5-10% slide will “feel” worse than it is.

As I stated, the market is overbought on multiple measures, which have typically coincided with short-term market peaks and corrections. With the S&P now trading more than 9% above the 200-dma, and all indicators back to overbought conditions, it is worth wary of potential short-term correction risks. 

SP500-Chart1-081420.png

Another way to look at deviations is where the S&P 500 ETF (SPY) trades relative to its 250-day volume-weighted average price (VWAP.) While deviations have been more extreme in the past, this is currently the highest level since February.

SP500-VWAP-250DMA-081420.png

All this indicator suggests it there is “fuel” for a correction in the markets short-term. What is needed, of course, is a “catalyst” to ignite sellers.

That is where our discussion of the “Income Cliff” comes in.


#16 dTraderB

dTraderB

    Member

  • Traders-Talk User
  • 17,282 posts

Posted 16 August 2020 - 08:06 AM

at LINK ABOVE

Sitting Closer To The Exit

Point 10 in Doug’s list is the most critical. 

What eventually sparks a reversion is always the one thing no one is anticipating. Throughout history, the unexpected, exogenous event is what sends investors fleeing for the exits. After the damage occurs, the media’s excuse is always: “Well, no one could have seen that coming.” 

As noted above, overbought, extended, overly bullish markets are by themselves “bullish.” These conditions represent the current “momentum,” which keeps pushing assets higher and dragging investors into the market.

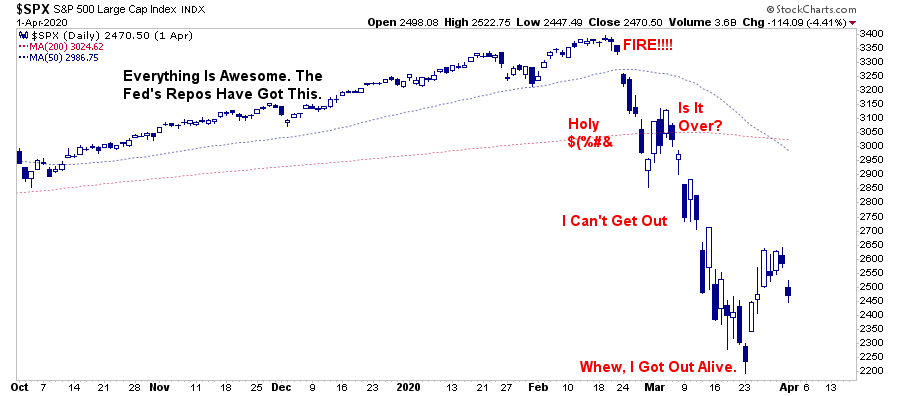
It’s very much like a crowded theater. Everything is fine, until that point where someone yells “fire.” At that point, everyone tries to rush towards a very narrow exit. The same holds for the market. 

Such was a point we discussed in 2017 in the “Rise Of The Robots:”

“At some point, that reversion process will take hold. It is then investor ‘psychology’ will collide with ‘margin debt’ and ETF liquidity. 

When the ‘robot trading algorithms’ begin to reverse, it will not be a slow and methodical process but rather a stampede with little regard to price, valuation n or fundamental measures. The exit will become very narrow.

Importantly, as prices decline, it will trigger margin calls, which will induce more indiscriminate selling. The forced redemption cycle will cause catastrophic spreads between the current bid and ask pricing for ETF’s. Such forces investors to dump positions to meet margin calls, the lack of buyers will form a vacuum causing rapid price declines. Such leaves investors helpless on the sidelines watching capital appreciation vanish in moments.”

No one believed me then. But it is what happened in March of 2020.

Market-2020-Decline.png

Hedging Risk

For all of these reasons, this is why we are sitting closer to exit. 

Retail investors have packed themselves into the same theater under the belief that asset prices can only go higher. As noted, numerous things could spark a “fire.” 

Furthermore, over the last couple of weeks, our portfolios remain weighted towards equity risk. Such makes us very uncomfortable, as “risk” controls are the backbone of our process. 

Such remains the case this week. 
https://realinvestme...highs-08-14-20/

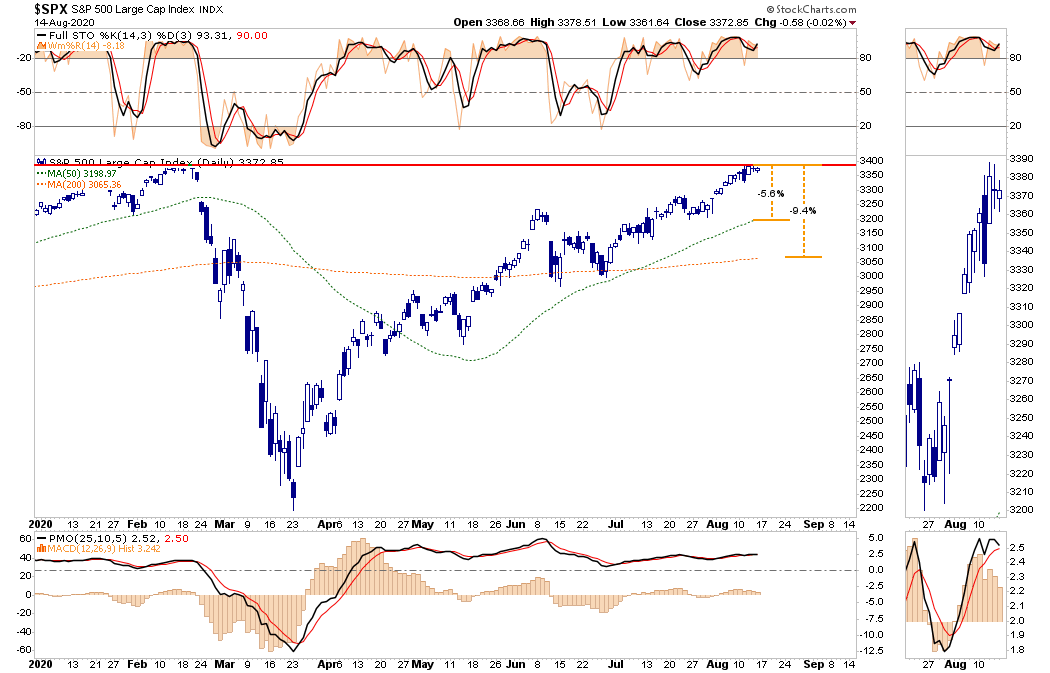
Given we are now getting more extreme short-term overbought conditions, the risk of a short-term reversion has risen. Therefore, we continued making changes to portfolios last week. 


#17 dTraderB

dTraderB

    Member

  • Traders-Talk User
  • 17,282 posts

Posted 16 August 2020 - 08:06 AM

10-Other Factors That Could Spark A Correction

“My view is that the period leading up to the November election holds a list of unique and potentially worrisome risks:

  1. Fundamentals Remain Too Optimistic. 
  2. Technical Deterioration. Market breadth and new highs (only 59 yesterday), investor sentiment is growing ebullient (put/call ratios at a multi-month lows), the National Association of Active Investment Managers (NAAIM) has its highest long exposure in years at 102.4.
  3. Covid-19 Remains A Wildcard. Currently, the virus continues to spread, and fatalities are expanding. Travel restrictions are tightening, schools and universities closing or have a reduced schedule, and small business openings remain uncertain. The recent fragile rise in consumer and business confidence could be fleeting.
  4. Speculation Is Beginning to Moderate. Losses in the “shiny objects” may now be accumulating. 
  5. The China/U.S. Rift Is Widening. China will likely play hardball in the face of a potential change of the Presidency. 
  6. For a Host of Reasons, Our Society is Fractured. An intensification of violence could shake confidence as social issues become more heated, leading into the November election. 
  7. The Social Safety Net Is Beginning to Fade. Federal unemployment benefits are getting extended but only a fraction of the $600. PPP is expiring in early August and is not being replaced or at a fraction of the previous level.
  8. Market Structure Remains a Significant Risk. The intoxicating advance since March could easily move into reverse. “buyers live higher, but sellers live lower.”
  9. A Democratic Sweep Will Result in More Distributional Policies. 
  10. Higher individual and corporate tax rates, a possible wealth tax, and potential threats to the tech market leaders’ monopolistic positions could undermine growth.
  11. There Are Numerous Knock On Problems That Could Reverberate in Our Economic and Markets Systems. Let’s call this the “unknowable”. 

https://realinvestme...highs-08-14-20/


#18 dTraderB

dTraderB

    Member

  • Traders-Talk User
  • 17,282 posts

Posted 16 August 2020 - 08:11 AM

OK, weekly updates to computers done, later


One of my best NQ week, great UP & DOWN moves, but several snooze periods

Bad OPTIONS week but some daytrading in QQQ PUTS and hedging cut losses significantly


Holding 

31 QQQ PUTS -- would like to add at least 10 if QQQ rallies another 8 to 12 points points

14 SPY PUTS

I NQ hedge long

2 CRUDE SHORT mini


#19 da_cheif

da_cheif

    Member

  • Traders-Talk User
  • 10,960 posts

Posted 16 August 2020 - 10:16 PM

OK, weekly updates to computers done, later


One of my best NQ week, great UP & DOWN moves, but several snooze periods

Bad OPTIONS week but some daytrading in QQQ PUTS and hedging cut losses significantly


Holding 

31 QQQ PUTS -- would like to add at least 10 if QQQ rallies another 8 to 12 points points

14 SPY PUTS

I NQ hedge long

2 CRUDE SHORT mini

geeziz    all that work and ur still chort.......:>)


#20 redfoliage2

redfoliage2

    Member

  • Traders-Talk User
  • 18,018 posts

Posted 17 August 2020 - 08:16 AM

ar link above:


A Normal Correction Is Likely

With the markets overbought on several measures, there is a downside risk heading into the end of the month. These risks come from several fronts we will discuss momentarily. However, from a technical perspective, the downside risk is about 5.6% to the 50-dma and 9.4% to the 200-dma. (Shown above)

A 5-10% decline in any given year is not outside of the norm. However, since investors have entirely forgotten what a drop feels like, a 5-10% slide will “feel” worse than it is.

As I stated, the market is overbought on multiple measures, which have typically coincided with short-term market peaks and corrections. With the S&P now trading more than 9% above the 200-dma, and all indicators back to overbought conditions, it is worth wary of potential short-term correction risks. 

SP500-Chart1-081420.png

Another way to look at deviations is where the S&P 500 ETF (SPY) trades relative to its 250-day volume-weighted average price (VWAP.) While deviations have been more extreme in the past, this is currently the highest level since February.

SP500-VWAP-250DMA-081420.png

All this indicator suggests it there is “fuel” for a correction in the markets short-term. What is needed, of course, is a “catalyst” to ignite sellers.

That is where our discussion of the “Income Cliff” comes in.

5% is normal, but I doubt the Fed will allow a 10% correction ...............