https://www.marketin...llan-oscillator
and
https://www.marketin...ine-volume-line

Member
Posted 22 August 2020 - 09:12 AM
as is the case of overbought or oversold, this Index can levitate at extreme levels for days, weeks, months....
NAAIM Exposure Index
The NAAIM Exposure Index represents the average exposure to US Equity markets reported by our members.
The green line shows the close of the S&P 500 Total Return Index on the survey date. The blue line depicts a two-week moving average of the NAAIM managers’ responses.
It is important to recognize that the NAAIM Exposure Index is not predictive in nature and is of little value in attempting to determine what the stock market will do in the future. The primary goal of most active managers is to manage the risk/reward relationship of the stock market and to stay in tune with what the market is doing at any given time. As the name indicates, the NAAIM Exposure Index provides insight into the actual adjustments active risk managers have made to client accounts over the past two weeks. ,306.51 Aug 12, 2020 3,380.35 Aug 19, 2020 3,374.85
This week’s NAAIM Exposure Index number is:
100.13
Last Quarter Average
65.79
http://www.naaim.org...exposure-index/
Edited by dTraderB, 22 August 2020 - 09:14 AM.
Member
Posted 22 August 2020 - 09:16 AM
Some of these are archaic and not as important as before .. people usually write what I just wrote either at extreme market levels or in abnormal markets or when confused and trying to make sense out of abnormality LOL
https://www.nasdaq.c...vity/isee-index
Member
Posted 22 August 2020 - 09:18 AM
Member
Posted 22 August 2020 - 09:21 AM
Member
Posted 22 August 2020 - 09:25 AM
Good stuff at Helene, weekly updated completed, outa here:
Member
Posted 22 August 2020 - 09:29 AM
#SPX | Bears Are Going Extinct in Stock Market’s $13 Trillion Rebound - Bloomberg *Link: https://bloom.bg/2YFoSCz
https://twitter.com/sunchartist
Member

Posted 22 August 2020 - 02:20 PM
?
>throw out TA< WHY ....IT GOT ME THIS FARMember


Posted 22 August 2020 - 02:38 PM
.
Bears Are Going Extinct in Stock Market’s $13 Trillion ReboundAfter a five-month, uninterrupted rally, the market is starting to show signs of fatigue. While the S&P 500 rose in four of the past five days, none of the gains topped 0.5%.
“It felt more like a lack of desire to sell rather than enthusiasm to buy except for some select rotating pockets of the market that are still attracting speculators,” said Andrew Adams, a strategist at Saut Strategy. “We will just have to see if the S&P 500 hitting new highs wakes the market up and entices some new buyers to enter.”
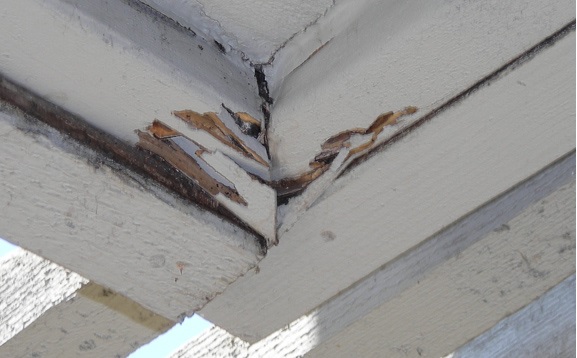
Looks like a brand new paint job...right over the termites.
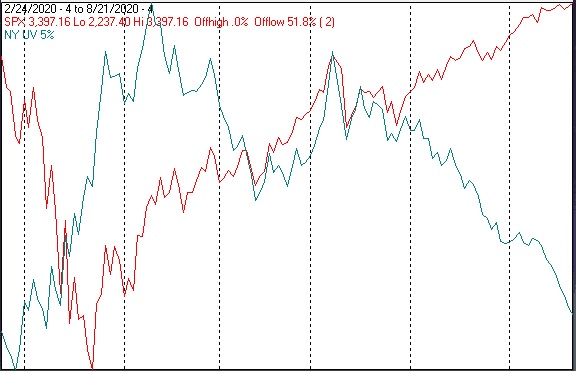
This is a bizarre chart showing UV crashing, while the SPX is hitting a new high. A sign of the times.
Edited by Rogerdodger, 22 August 2020 - 02:47 PM.
Member
Posted 23 August 2020 - 07:32 AM


