Jump to content


Photo

NEW BULL MARKET! SPX 4000 ahead


  • Please log in to reply
233 replies to this topic

#1 dTraderB

dTraderB

    Member

  • Traders-Talk User
  • 17,170 posts

Posted 30 August 2020 - 05:50 PM

NO way! But, the IT LONG trend continues in what has to be the bubbliest of bubbles in modern times. 


This bubble has fuel now and promised in the future and could continue since there appears to be massive hedging. 


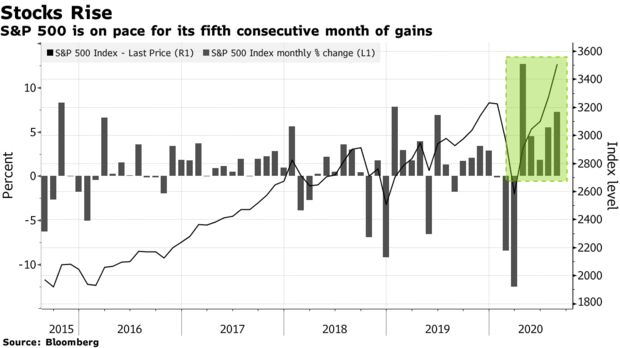
Last week was a rare down one but early large losses were reduced during Wed to Friday. 


In our LT Portfolio we are adopting a new strategy:

BUY SPY PUTS as market rises and then buy stocks when market drops. 

BUT, what if market never drops?  It will, son, it bubbles always burst!


Made a few $$ with APPLE PUTS and still holding 5 n the LT Portfolio. 


SPX 4K came from one of the last few remaining bears
 

Bear Capitulation

capitulation.jpg?resize=197%2C131&ssl=1Relentless squeeze in $SPX and $NDX to ever higher highs and bears are capitulating left, right and center. Short interest at 15 year lows, asset manager index parked north of 100, the complete elimination of down days in August, in short: The perfect bear set up.


#2 dTraderB

dTraderB

    Member

  • Traders-Talk User
  • 17,170 posts

Posted 30 August 2020 - 05:52 PM

NQ has been lagging but anyone who trades it knows that it can erase tha tlag and zoom ahead in a few hours! 
 

"Specifically the chart that is flashing red here is the $NASI, the Nasdaq summation index.

It has built a very specific structure that has signaled sizable corrections coming in the past couple of years.

While $NDX keeps making new highs NASI’s price action weakens on new highs, while $NDX is engaged in a pattern of price compression as it keeps rising in a steep rising channel patterns."
https://northmantrad...27/tech-signal/


#3 dTraderB

dTraderB

    Member

  • Traders-Talk User
  • 17,170 posts

Posted 30 August 2020 - 05:56 PM

This stock market rally has really long legs, according to six strategists. Here’s the proof
 
The market’s relentless run has prompted many analysts to check what’s under the hood. Some now see evidence to justify further gains, citing everything from the Federal Reserve’s new policy goals to sidelined piles of cash that are ready to be deployed.


“I can’t see what’s going to change people’s perspective on why we should stop buying,” said Randy Frederick, vice president of trading and derivatives at Charles Schwab & Co. “If we continue to buy and we have a few more pullbacks, which I think is likely, people will just continue to jump in and buy those dips.”


620x-1.png

In the wake of the S&P 500’s surge, a number of strategists have raised their forecast for where the index will end the year. Those at Goldman Sachs Group and RBC Capital Markets did so earlier this summer. On Friday, Brian Belski, chief investment strategist at BMO Capital Markets, reinstated his year-end S&P 500 target of 3,650. That represents a roughly 4% advance from current levels.


#4 dTraderB

dTraderB

    Member

  • Traders-Talk User
  • 17,170 posts

Posted 30 August 2020 - 05:58 PM

Saturday Poll (I forgot to do this earlier!) Next 100 points for the S&P?
56% uo
44% down
 
UP
55.9%
 
DOWN
44.1%
1,794 votes · Final results


#5 dTraderB

dTraderB

    Member

  • Traders-Talk User
  • 17,170 posts

Posted 30 August 2020 - 05:59 PM

Are you impressed by the 76% rise in Naz since the low? Hope you're equally impressed by the 75% rise in the Transports since the low. In fact maybe the rise in the Transports is more impressive when you consider the airlines are a big % of their make up


#6 dTraderB

dTraderB

    Member

  • Traders-Talk User
  • 17,170 posts

Posted 30 August 2020 - 06:01 PM

Dancing in the streets, bull euphoria

near 1.2


Citi Panic/Euphoria. This might be higher than 1999-2000 (unsure).


#7 dTraderB

dTraderB

    Member

  • Traders-Talk User
  • 17,170 posts

Posted 30 August 2020 - 06:04 PM

McClellan Summation Index still heading down. Needs a few more days of better breadth to turn up.
 
McClellanOsc_869.gif


#8 dTraderB

dTraderB

    Member

  • Traders-Talk User
  • 17,170 posts

Posted 30 August 2020 - 06:06 PM

A few points up and then dull

maybe not worth trading this evening


So will it crash now, ST? 

The S&P 500 set a 52-week high for a week straight. Every one of the sessions had a negative McClellan Oscillator. This has never happened before, using S&P stock data to 1998 or all NYSE securities back to 1962.


#9 dTraderB

dTraderB

    Member

  • Traders-Talk User
  • 17,170 posts

Posted 30 August 2020 - 06:07 PM

This is generating more than normal interest


https://www.marketin...summation-index


#10 dTraderB

dTraderB

    Member

  • Traders-Talk User
  • 17,170 posts

Posted 30 August 2020 - 06:11 PM

Have a great weekend! This years biggest test is this week as $SPX nears the trendline that caused every major selloff since 2012 at 3530 Plan: Looking higher to 3530. IF bulls break it, its a decade long breakout with 3650 next up. Ideally we get a good pullback to recharge 1st